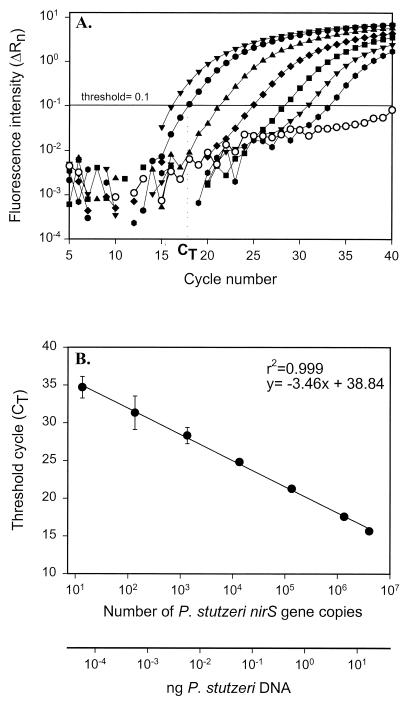
FIG. 1.
Generation of standard curve. (A) Increase of fluorescence intensity with cycle number for serially diluted P. stutzeri DNA. Symbols, from left to right: ▾, 17.8 ng; ●, 5.9 ng; ▴, 0.59 ng; ⧫, 59 pg; ■, 5.9 pg; ▾, 0.59 pg;  , 59 fg; ○, no-template control. CT, cycle at which the fluorescence intensity crosses an arbitrary threshold value. (B) Standard curve. Values represent means ± 95% confidence interval (n = 3).

