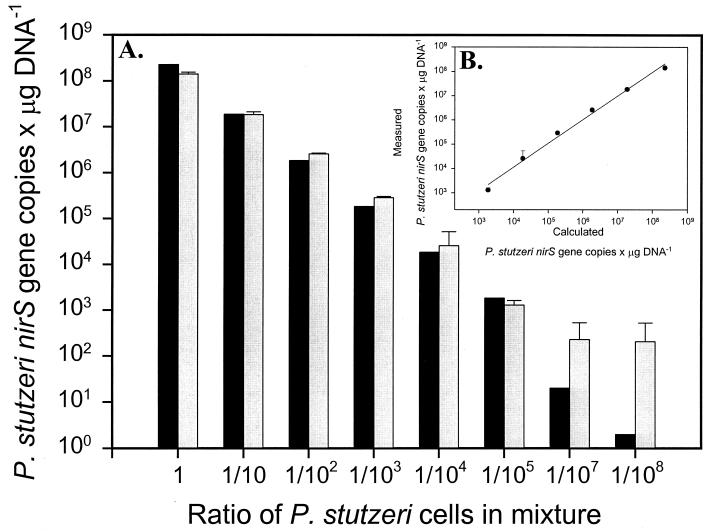
FIG. 4.
Quantification of nirS DNA in artificial mixtures of P. stutzeri KC, P. aeruginosa, and E. coli cells. (A) Comparison between P. stutzeri nirS gene copies per μg of DNA measured values by real-time PCR (gray bars) and calculated values based on cell counts (black bars). (B) Correlation between calculated and measured values (slope = 0.98, r2 = 0.992). Error bars represent 95% confidence intervals (n = 3) for both panels.

