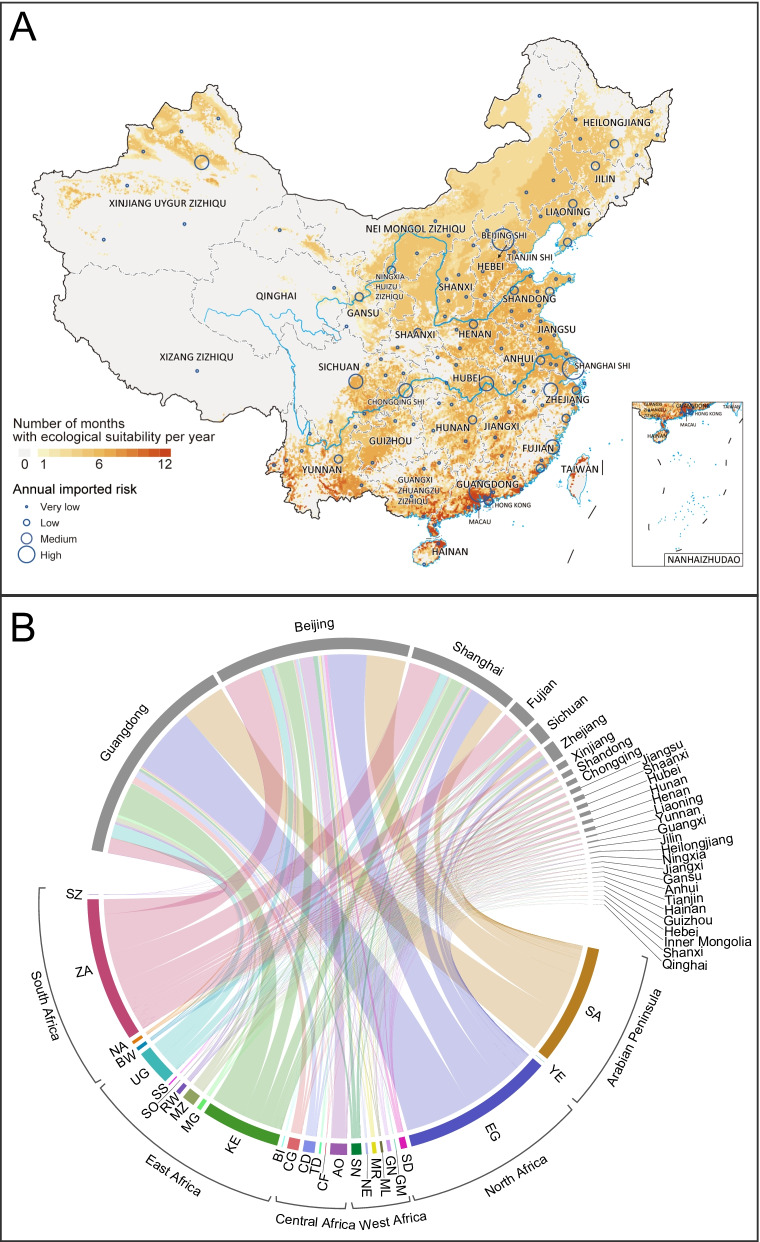
Fig. 5.
Average number of suitable months per year and annual imported risk for RVFV. A The average number of suitable months per year across years 2000–2020 was shown. Places in red were suitable for more months per year, on average. The annual imported risk index was calculated by adding the monthly imported risk index at the city level. The annual city imported risk level was classified into four categories: very low (imported risk index ≤ 10–2); low (imported risk index between 10–2 and 10–1); medium (imported risk index between 10–1 and 1); high (imported risk index > 1). B The annual imported risk was from the infected countries in RVFV epidemic area to the provinces in China. The annual imported risk index at the provincial level was calculated by adding the annual imported risk index of cities in the same province. The following are the full names of RVFV infected countries: SZ (Swaziland); ZA (South Africa); NA (Namibia); BW (Botswana); UG (Uganda); SS (South Sudan); SO (Somalia); RW (Rwanda); MZ (Mozambique); MG (Madagascar); KE (Kenya); BI (Burundi); CG (Republic of Congo); CD (Democratic Republic of the Congo); TD (Chad); CF (Central African Republic); AO (Angola); SN (Senegal); NE (Niger); MR (Mauritania); ML (Mali); GN (Guinea); GM (Gambia); SD (Sudan); EG (Egypt); YE (Yemen); SA (Saudi Arabia).
Source data are provided in Additional file 2

