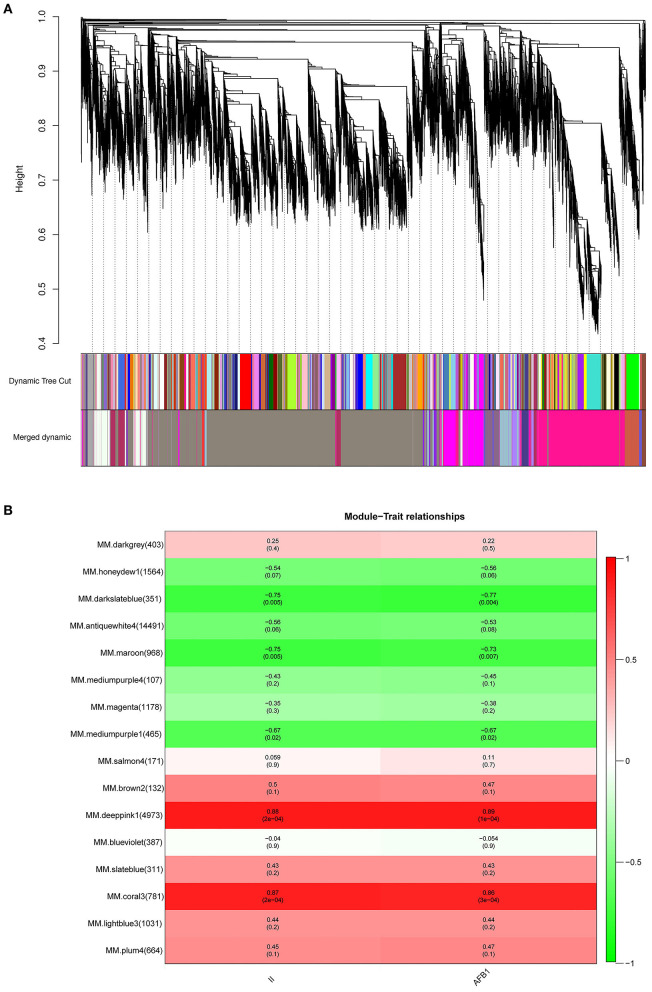
Figure 5.
Co-expression network analysis of DEGs and module-trait relationship (MTRs) in response to A. flavus. (A) Cluster dendrogram of different genes in co-expression modules. (B) Relationships between modules (left) and traits (bottom). The numbers in brackets on the left show the number of genes in each module. Red and green represent positive and negative correlations, respectively. The darker colors indicate higher correlation coefficients. Numbers represent Pearson's correlation coefficients r2-values and the P-value for the correlation (in brackets).

