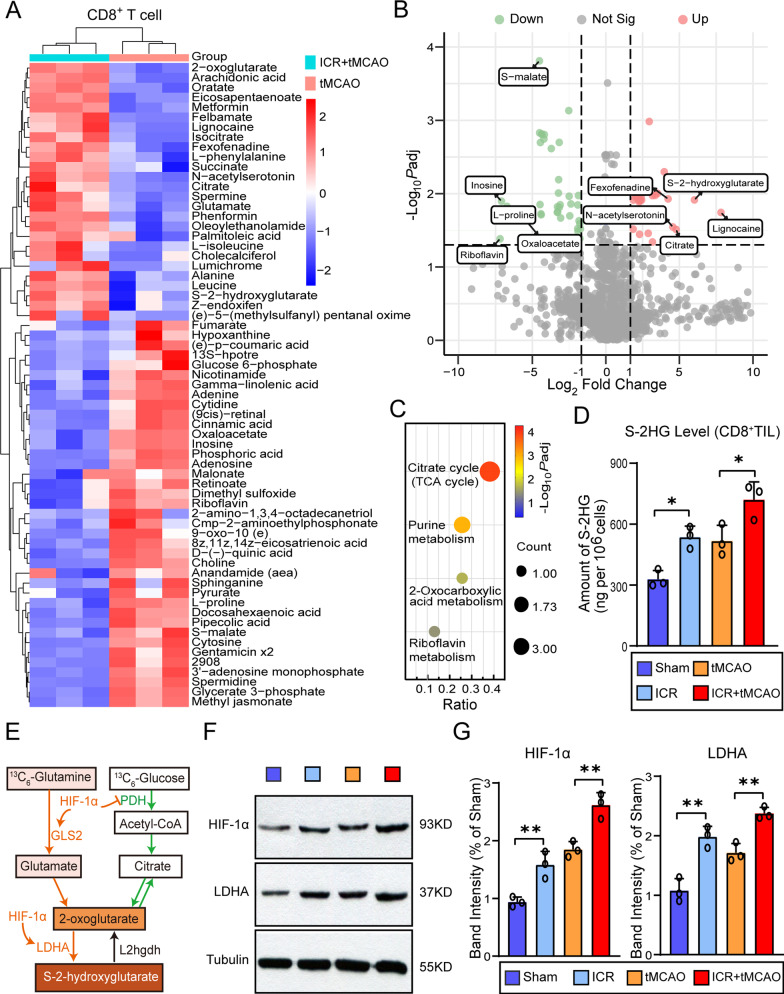
Fig. 5.
Accumulation of immunometabolite S-2HG in CD8+ T lymphocytes after perioperative ischemic stroke. A Heat map of all differentially expressed intracellular metabolites. The differential expressed metabolites were confirmed with a fold change distribution of ICR + tMCAO/tMCAO > 2.0 or < 0.5. B Volcano plot indicating the metabolites of differential accumulation [log2 (fold change) on X-axis] and significant change [− log10 Padj on Y-axis] in the ICR + tMCAO and tMCAO group. C KEGG analysis of enriched biological processes with differential expressed metabolites. D S-2HG levels in splenic CD8+ T cells sorted from perioperative stroke mice or stroke-only mice 3 days after tMCAO (n = 3/group). E Schematic showing the physiological and pathophysiological mechanism of S-2HG production, listing representative enzymes, and metabolic molecules. F, G Representative western blot images and quantification of HIF-1α or LDHA 3 days after stroke in the sorted splenic CD8+ T cells from perioperative stroke mice or stroke-only mice (n = 3/group). The sham mice were defined as the mice that underwent laparotomy without ICR. *P < 0.05, **P < 0.01

