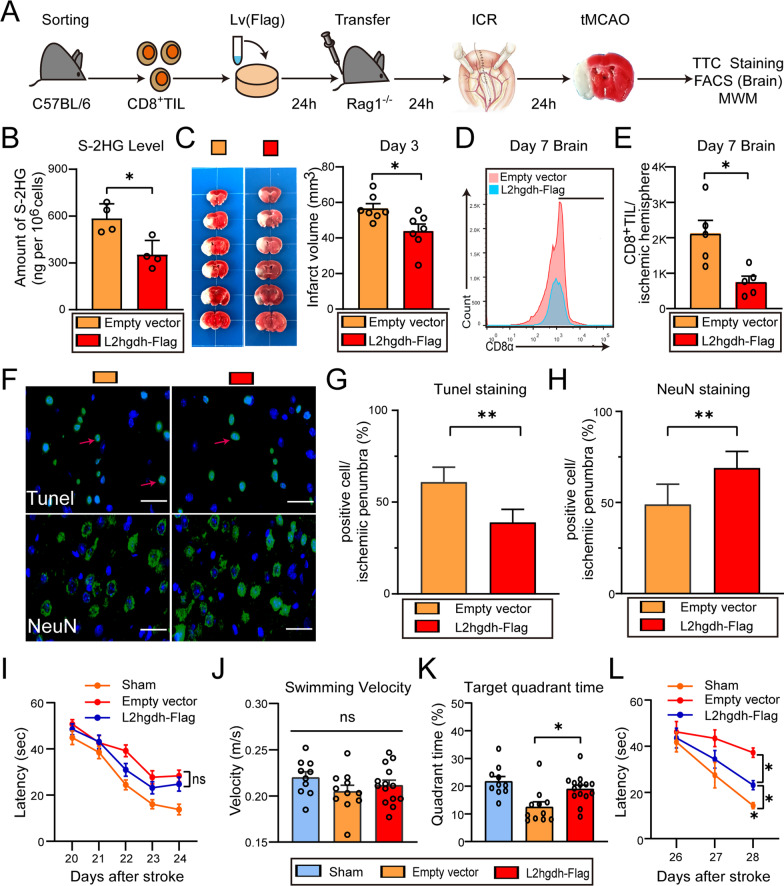
Fig. 7.
S-2HG exacerbates ischemic brain injury. A Flowchart illustrates the experimental design. B S-2HG levels in splenic CD8+ T cells transfected with lentiviral overexpression of L2hgdh. C Representative TTC-stained images and quantification (3 days after stroke) of Rag1−/− mice with adoptively transferred CD8+ T cells transfecting with lentivirus L2ghdh-Flag (n = 7/group). D, E Representative histogram (D) and absolute number (E) of brain-invading CD8+ T cells (7 days after stroke) of Rag1−/− mice with adoptively transferred CD8+ T cells transfecting with lentivirus L2ghdh-Flag (n = 5/group). F Representative images of brain tissue with Tunel staining or NeuN staining in the ischemic penumbra 7 days after stroke of Rag1−/− mice with adoptively transferred CD8+ T cells transfecting with lentivirus L2ghdh-Flag. Red arrows signify the injured neurons. Scale bar = 20 μm. G, H Quantification of Tunel+ cells (G) or NeuN+ cells (H) (n = 5/group). I Average escape latency in the navigation test. J Quantification of swimming speed during the probe test. K Time traveled in the target quadrant during probe test (n = 10–14/group). L Quantification of latency to the platform during spatial working memory testing (n = 10–14/group). The sham mice were defined as the mice that underwent laparotomy without ICR. *P < 0.05, **P < 0.01, ns indicates nonsignificant

