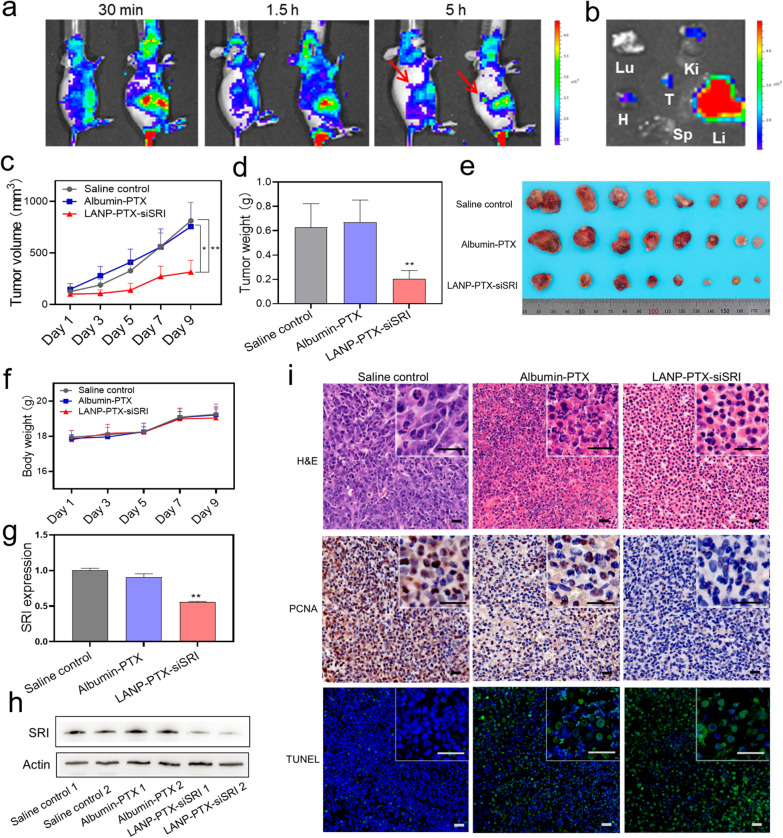
Fig. 5.
Suppression of PTX-resistant tumor growth by LANP-PTX-siSRI in vivo. a In vivo fluorescence imaging of Cy5.5 fluorescent-labeled LANP-PTX-siSRI (LANP-Cy5.5) at 30 min, 1.5 h, and 5 h after intravenous injection. Red arrows indicate the locations of tumors. b Ex vivo biodistributions of LANP-Cy5.5 at 5 h after intravenous injection. The column shows the intensity of ex vivo fluorescence and the major organs and the tumor were imaged. T, H, Li, Sp, Lu, and Ki stand for tumor, heart, liver, spleen, lung, and kidney, respectively. c Measurement of tumor volume during normal saline, albumin-PTX, and LANP-PTX-siSRI treatment. d Measurement of tumor weight in saline control, albumin-PTX, and LANP-PTX-siSRI groups after treatment. e Images of xenograft tumor after the sacrifice of mice. f Measurement of body weight in saline control, albumin-PTX, and LANP-PTX-siSRI groups during treatment. g Expression of SRI mRNA in tumor tissue of various groups after treatment determined by qRT-PCR. h Expression of SRI protein in tumor tissue of various groups after treatment detected by Western blot. i H&E, PCNA, and TUNEL stained tumor slices from various groups. Scale bar, 20 μm; *P < 0.05; **P < 0.01

