Figure 4.
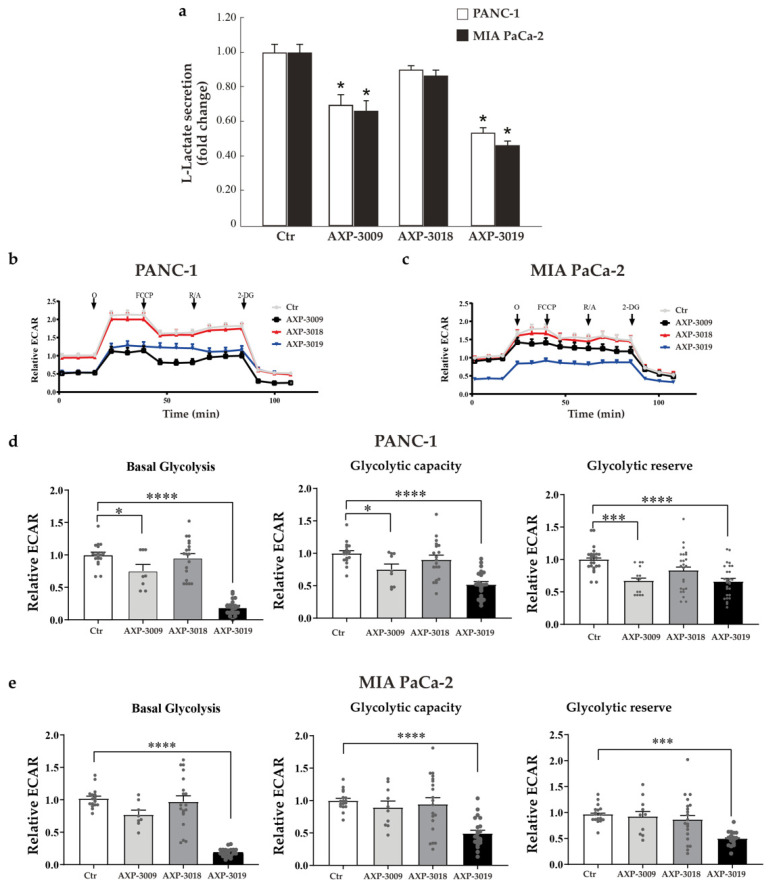
Glycolytic metabolism in PDAC cell lines. (a) Cells were seeded in 96-well plate and incubated with 10 μM of 3-bromo-isoxazoline derivatives for 48 h. Culture medium has been isolated and the amount of L-lactate analysed. Representative graphs of ECAR profiles of PANC-1 (b) and MIA PaCa-2 (c) treated with 10 μM of 3-bromo-isoxazoline derivatives for 48 h; O = oligomycin; FCCP = Carbonyl cyanide 4-(trifluoromethoxy)phenylhydrazone; R/A = Rotenone/Antimycin A; 2-DG = 2-Deoxy-D-glucose. Glycolytic parameters (d,e) were normalized on the total DNA content per well, calculated as detailed in Material and Methods and expressed as fold-change compared to untreated controls. Statistical analysis was performed with one-way ANOVA and Dunnett’s multiple comparisons test * p < 0.05,*** p < 0.005, **** p< 00001.

