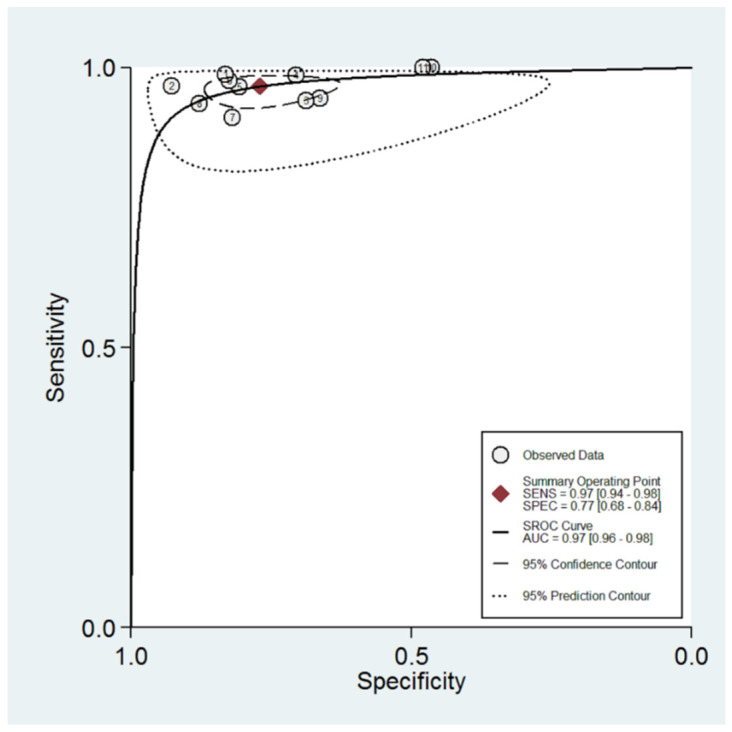
Figure 4.
Summary ROC curve for O-RADS reporting system showing the sensitivity and specificity for each study and pooled estimation. The dashed line around the summary point estimate (red diamond) represents the 95% confidence region. The dotted line showing the 95% prediction contour corresponds to the predicted performance taking into account all individual studies.

