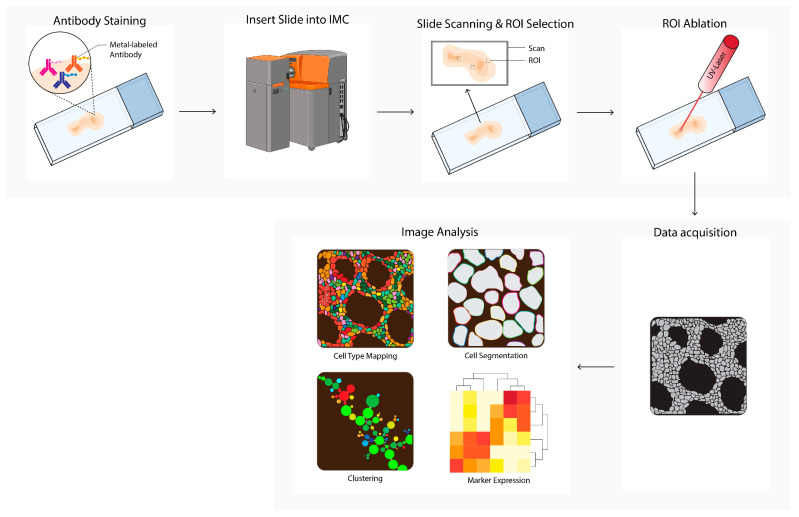
Figure 5.
Imaging mass cytometry (IMC) workflow. Tissues are first labeled with a multiplex panel of antibodies conjugated with heavy metal containing polymers. Next, the slide is inserted into the imaging mass cytometer (IMC) and regions of interest (ROI) are selected. Small pieces of 1 uM2 of labeled tissue are consecutively ablated with a UV-laser and ionized. Ions are filtered and detected by time-of flight mass spectrometry. Next, multiplex images are generated, containing images depicting expressions for each separate antibody–metal conjugate. During imaging analysis, these images can be processed into single-cell expression data and downstream analysis is performed (e.g., cell type mapping, clustering, marker expression). The Hyperion cartoon was acquired from BioRender.

