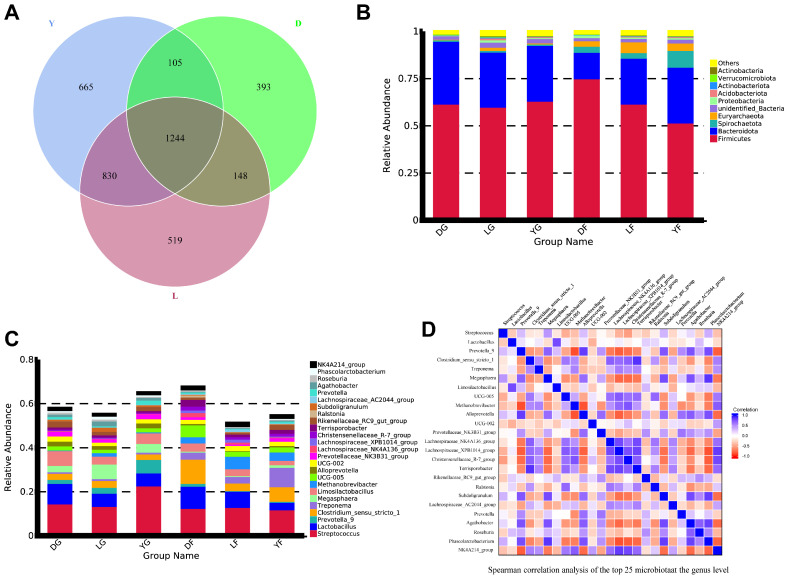
Figure 3.
Number of operational taxonomic units (OTUs) and abundance analysis of annotated species in the gut microbiota of gilts of three different breeds at early and finishing growth stages. (A) Venn diagram of the number of OTUs in different pig breeds. D—Duroc; L—Landrace; Y—Yorkshire. (B) Histogram of the phylum-level relative abundance at the phylum level in different sample groups. DG—Duroc at early growth stage; LG—Landrace at early growth stage; YG—Yorkshire at early growth stage; DF—Duroc at finishing stage; LF—Landrace at finishing stage; YF—Yorkshire at finishing stage. (C) Histogram of the genus-level relative abundance in different sample groups. (D) Heatmap of Spearman correlation coefficients at the genus level.

