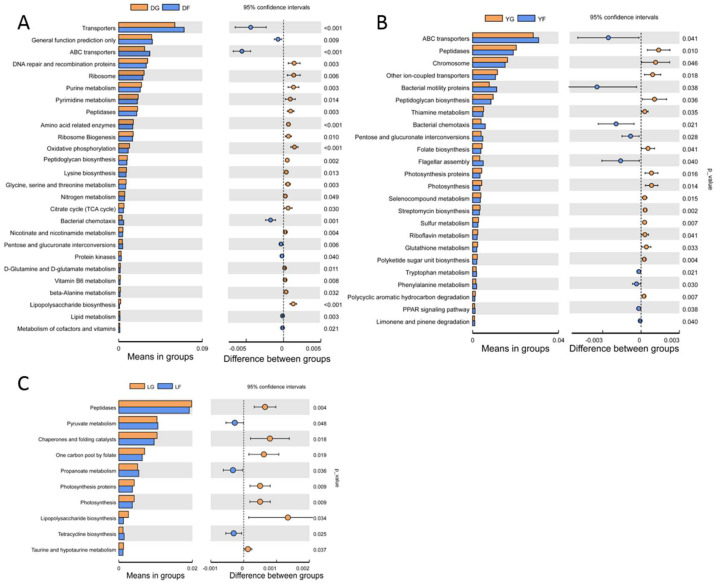
Figure 7.
Differences in the abundance of annotated KEGG levels (level 3) of gut microbiota composition of pigs of three different breeds at the different growth stages based on T-test analysis. (A) Duroc pigs. (B) Landrace pigs. (C) Yorkshire pigs. Extended error bar plot significant differences between early and finishing growth stages with corrected p values shown on the right.

