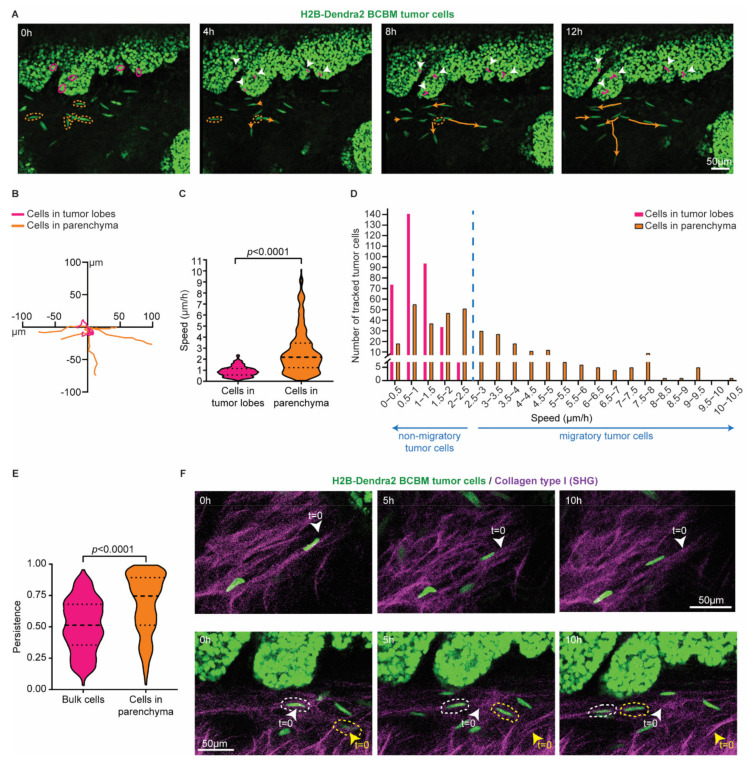
Figure 2.
Single cells at the invasive front of BCBM are highly migratory. (A) Representative still images from a time-lapse multi-photon tracking of BCBM through a cranial window. BCBM tumor cells expressing H2B-Dendra2 were imaged every hour for up to 12 h. Randomly picked cancer cells located in the tumor lobe or brain parenchyma are marked with a circle in magenta and orange, respectively. Tracks are depicted once cells move. Migratory tracks depict the total movement of tumor cells in the tumor lobes (magenta tracks and white arrowheads) and brain parenchyma (orange tracks). (B) Rose plot representation of the migratory tracks with a common origin of tumor cells displayed in (A). (C) Quantification of the speed of tumor cells in the tumor lobes (magenta) or brain parenchyma (orange); n = 350 tumor cells per condition imaged in 3 mice; p-value was determined using a Mann–Whitney t-test, two-tailed. (D) Distribution of tumor cell speed for cells present in the tumor lobes and in the brain parenchyma. (E) Quantification of the persistence of migratory tracks from a total of 350 tumor cells per condition from 3 mice. p-value was determined with a Mann–Whitney t-test, two-tailed. (F) Representative still images of a time-lapse multi-photon movie showing the migration of BCBM tumor cells along crosslinked collagen type I fibers (SHG channel) in two distinct areas.

