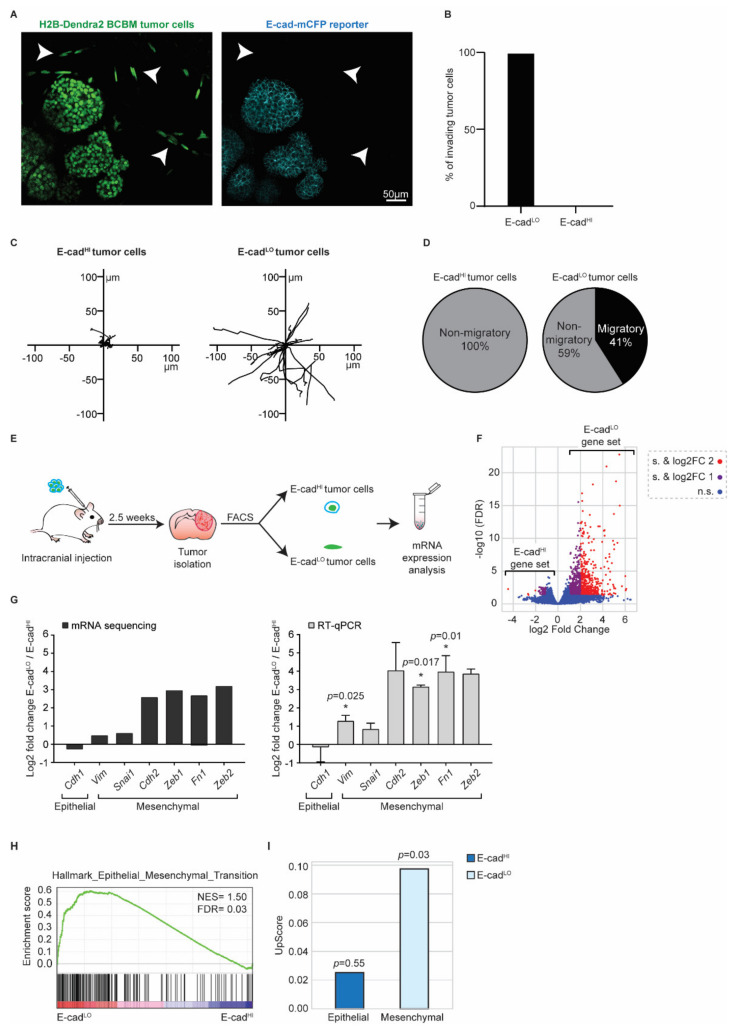
Figure 5.
BCBM invading tumor cells are in a mesenchymal state. (A) Representative multi-photon images of BCBM tumor cells expressing H2B-Dendra2 (green) and endogenous E-cad-mCFP (turquoise). White arrowheads point to invading tumor cells. (B) Percentage of invading tumor cells that are E-cadLO and E-cadHI. (C) Representative rose plots of migratory tracks with a common origin of 20 E-cadHI tumor cells and 20 E-cadLO tumor cells imaged using multi-photon imaging through a cranial window. (D) Pie charts of migratory (speed ≥ 2.5 µm/h) E-cadHI or E-cadLO tumor cells. (E) Schematic representation of experimental design used for isolating E-cadHI or E-cadLO tumor cells for mRNA sequencing and RT-qPCR. (F) Volcano plot comparing the fold change and false discovery rate (FDR) of E-cadHI and E-cadLO BCBM tumor cells. (G) mRNA expression analysis of EMT-related genes by mRNA sequencing and RT-qPCR; n = 4 for mRNA sequencing and n = 3 for RT-qPCR with exception for Cdh2 and Zeb2, which are n = 2. Data are presented as mean +/− SEM and standard deviation (SD) for Cdh2 and Zeb2. p-values were determined with a one-sample t-test, one-tailed between E-cadLO and E-cadHI tumor cells. (H) Gene set enrichment analysis [41] showing enrichment of the signature “Hallmark Epithelial_Mesenchymal_Transition” in E-cadLO BCBM tumor cells. (I) Upscore enrichment of E-cadHI or E-cadLO BCBM tumor cells in E-cadLO breast tumor cells [27]. Value of 0 implies that there is no enrichment of one gene set over the other. p-values were determined with a one-sample t-test to calculate the significance to 0.

