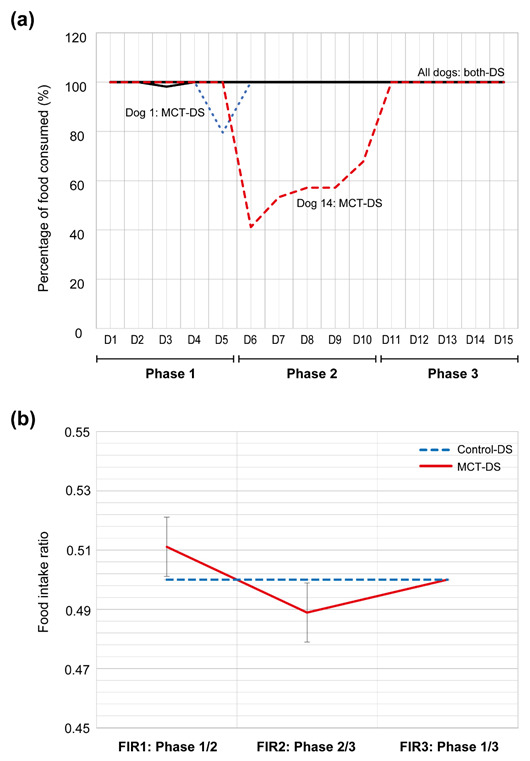
Figure 2.

Food consumption plots. (a) Plot showing the percentage of food consumed in each study phase. (b) Plot showing the food intake ratio per phase (FIR). A calculated FIR of 0.50 represents an equivalent consumption rate. An FIR greater or lower than 0.50 indicates an increase or decrease in the quantity of food consumed, respectively. The FIR of MCT-DS did not exhibit a statistically significant difference when compared to the control-DS throughout all the study phases.
