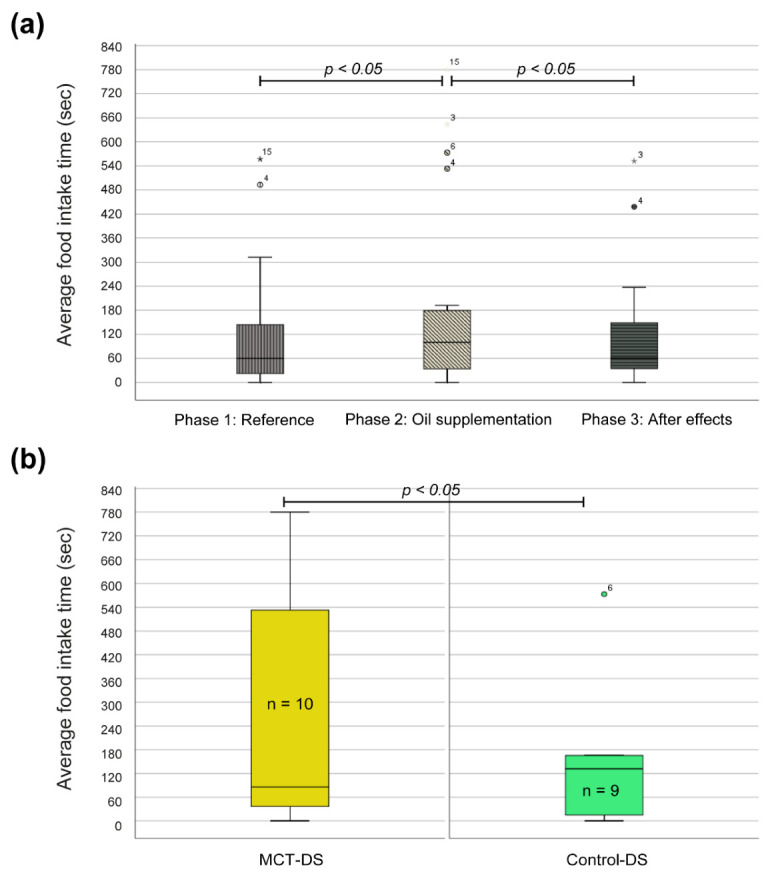
Figure 3.

Effects of oil supplementation on the average food intake time (aFIT). (a) Box and whisker plots of the aFIT per study phase measured in seconds. (b) Box and whisker plots of the aFIT differentiated by oil type. The central lines of the box and whisker plots represent the median, while the lower and upper limits of the box represent the 25th and 75th percentiles, respectively, and whiskers represent the minimum and maximum. Two-tailed Wilcoxon tests were conducted to compare aFIT per phase and independent t-test for comparison of both DS types.
