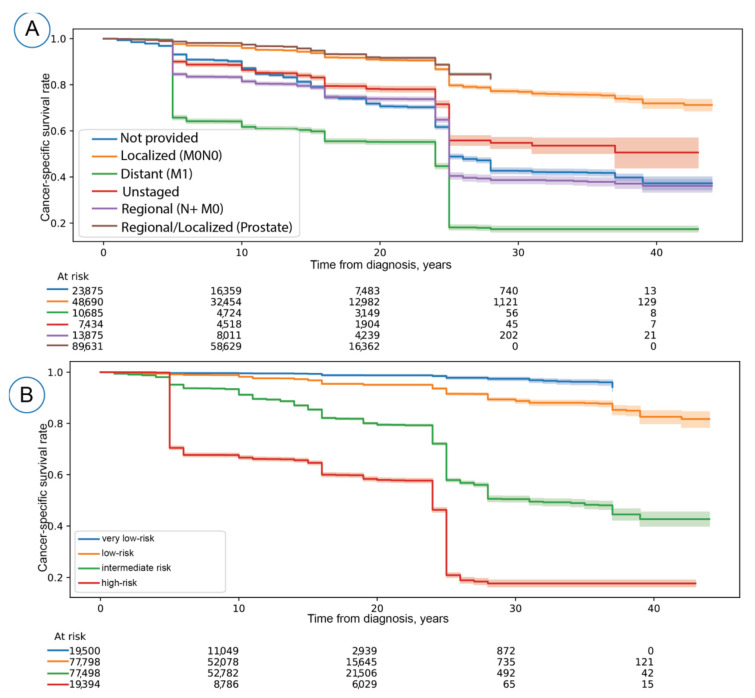
Figure 2.
(A) the Kaplan–Meier (KM) Curves for the SEER staging groups and (B) KM curve after stratifying the prognosticated survival probabilities using quantile thresholds (10%, 50%, 90%) defined on the training set. The KM curves form A and B were significantly discriminative (Log-rank p < 0.005). For (A), we calculated Log-rank P using localized, distant, regional, and regional/localized stage groups. Localized and regional prostate cancer cases were combined due to their high 5-year survival rates (nearly 100%) compared to other entities. The KM curves were generated on the test set. 95% Confidence intervals are visualized as bands around KM curves.

