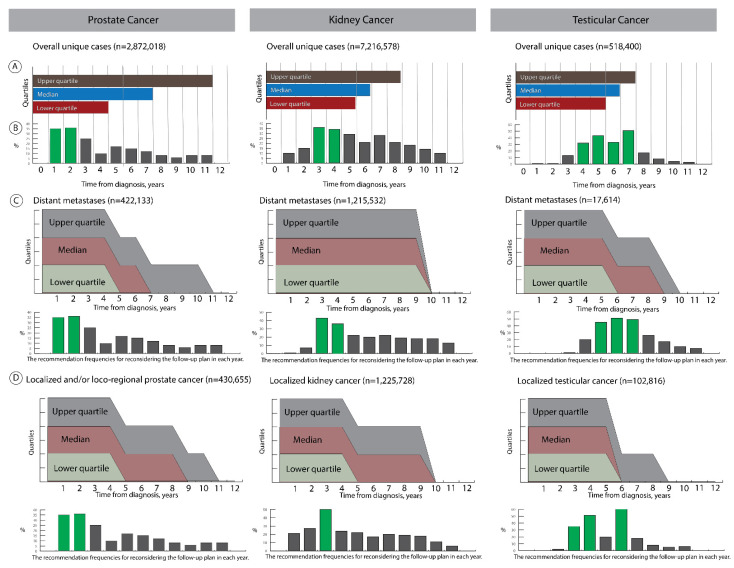
Figure 3.
Describes the results of the simulation for the follow-up duration assessment and the risk-profile stability of unique clinical conditions in prostate, kidney, and testicular cancers for all simulation cases (A,B) and after stratifying according to the tumor dissemination status (C,D). The lower quartile corresponds with the minimum recommended follow-up duration. The green bars highlight the years more likely have stable cancer-specific mortality risk compared to other years.

