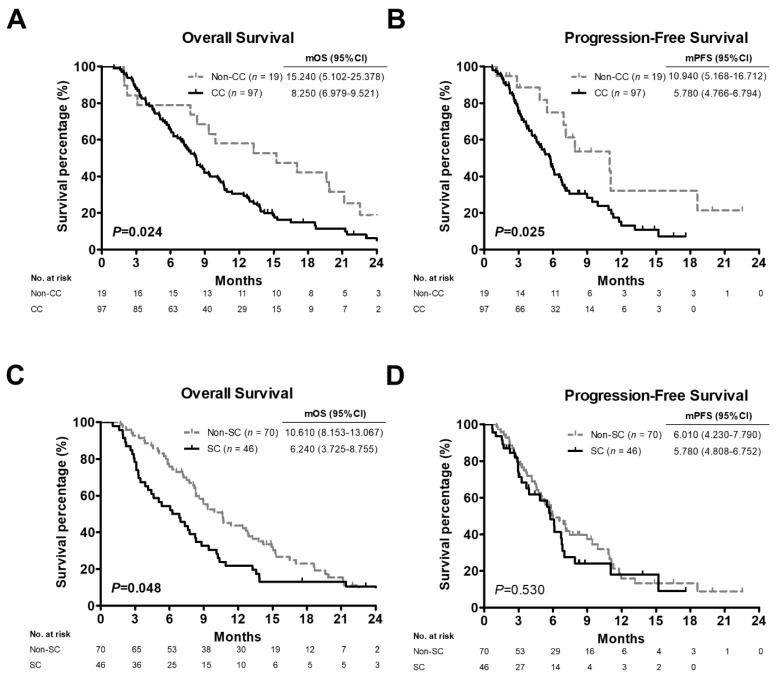
Figure 4.
Kaplan-Meier analysis plotting the survival curves of 116 pancreatic cancer patients with BMI > 22 according to cancer cachexia or sarcopenia status. (A,C) Overall survival curves of patients with BMI > 22 stratified by cancer cachexia (A) or sarcopenia (C). (B,D) Progression-free survival curves of patients with BMI > 22 stratified by cancer cachexia (B) or sarcopenia (D). p values determined using the log-rank test. BMI, body mass index; CC, positive cancer cachexia status; Non-CC, negative cancer cachexia status; SC, positive sarcopenia status; Non-SC, negative sarcopenia status; mOS, median overall survival; mPFS, median progression-free survival; CI, confidence interval.

