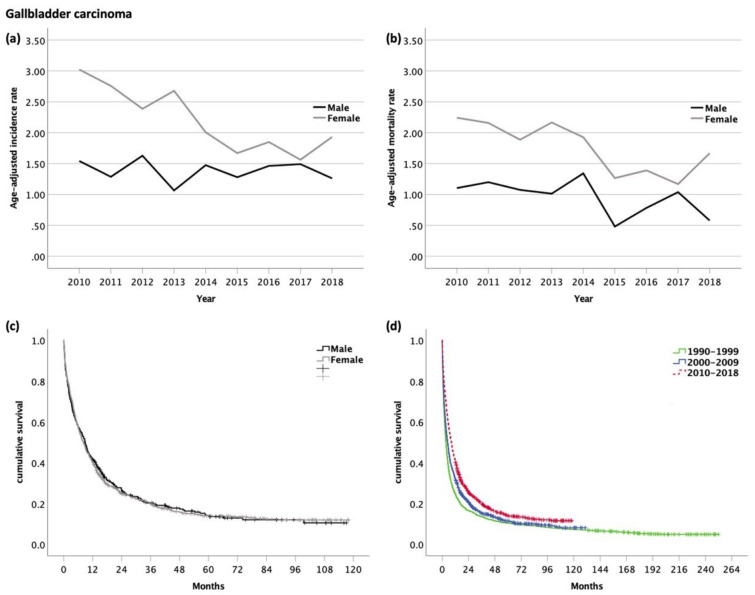
Figure 4.
(a) Age-adjusted incidence rate (per 100,000); (b) age-adjusted mortality rate (per 100,000) of patients with gallbladder carcinoma. Kaplan–Meier curves of patients with gallbladder carcinoma: (c) Male vs. female patients (median OS for m and f, 8.8 and 8.2 months, respectively, p = 0.854); (d) comparison of OS with former time periods (median OS for 1990–1999, 3.4 months; 2000–2009, 4.9 months; 2010–2018, 3.4 8.5 months; p < 0.001).

