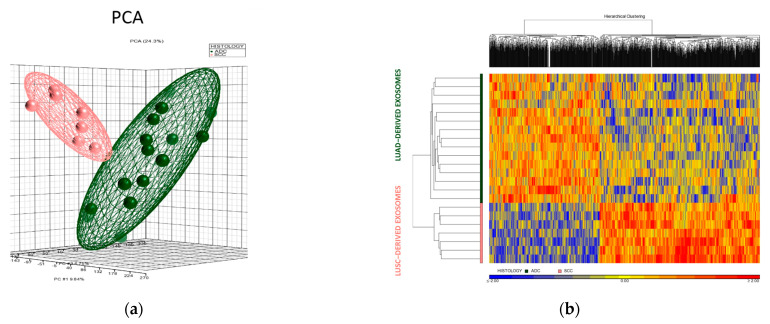
Figure 3.
Transcriptomic microarray analysis of cargo of tumor cell culture-derived exosomes. (a) PCA plot of H1650, H1975, H2228, SW900, FIS 301 and FIS 343 exosome samples under 2D and 3D conditions (using two biological replicates for each sample) distributed according to histology. (b) Hierarchical cluster analysis of differentially expressed probes between LUAD and LUSC. Red color represents overexpression and blue represents underexpression. Rows correspond to the exosome samples analyzed while columns represent the probes detected throughout the samples.

