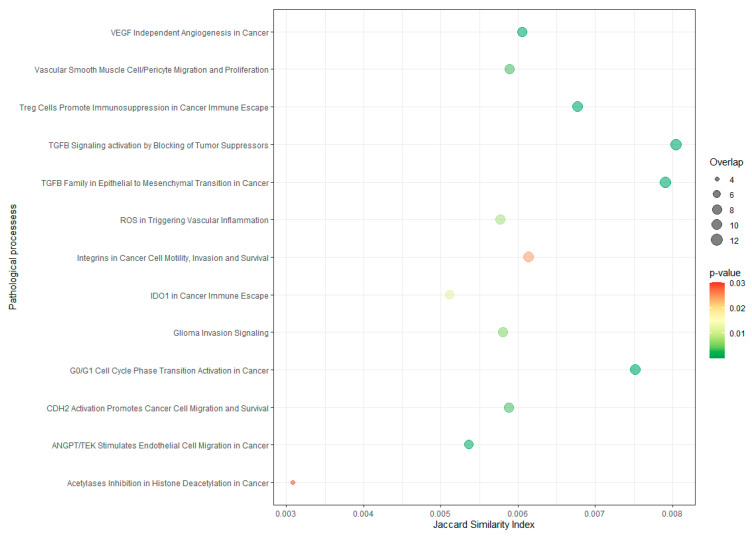
Figure 4.
Pathological process enrichment in differentially expressed genes seen in tumor culture-derived exosomes. Y axis indicates the name of the pathological process and X axis indicates the Jaccard similarity index (JSI). The bubble size indicates the number of overlapped genes for each process. The color bar indicates the p-value, representing in red the highest value (0.03), whereas values lower than 0.01 are represented in green.

