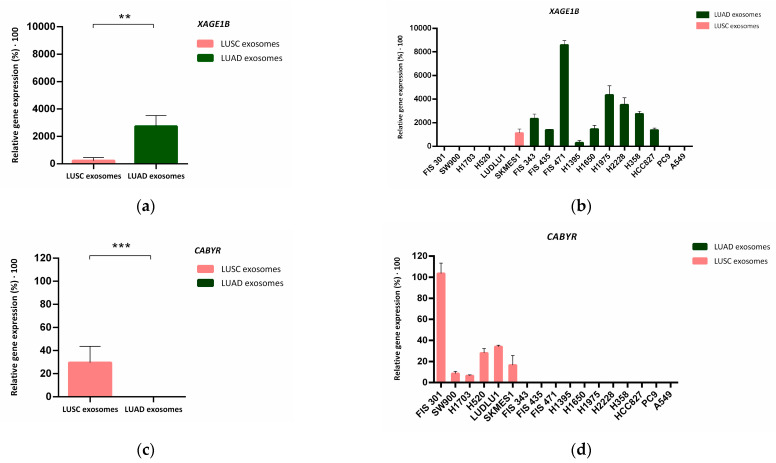
Figure 5.
Validation of XAGE1B and CABYR expression in tumor-derived exosomes from 2D cell cultures. (a–c) Median of relative gene expression of XAGE1B and CABYR measured via RT-qPCR in both histological groups. Error bars represent SD. Dark green bars correspond to LUAD-derived exosomes while salmon bars correspond to exosomes derived from LUSC samples. (b–d) Mean with SD of de relative gene expression of XAGE1B and CABYR to reference genes ACTB and GAPDH analysed in the complete group of cell cultures-derived exosomes. Significance values were ** p ≤ 0.01, and *** p ≤ 0.001.

