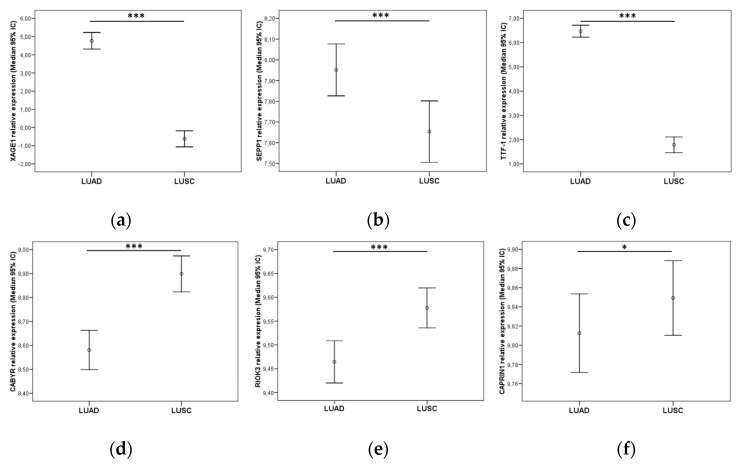
Figure 7.
Relative expression of (a) XAGE1, (b) SEPP1, (c) TTF-1 in the TCGA LUAD cohort and (d) CABYR, (e) RIOK3, (f) CAPRIN1 in the LUSC cohort. Graphics represent median with 95% CI (confidence interval). p-values were obtained using Mann–Whitney U-tests. Significance values were * p < 0.05 and *** p ≤ 0.001.

