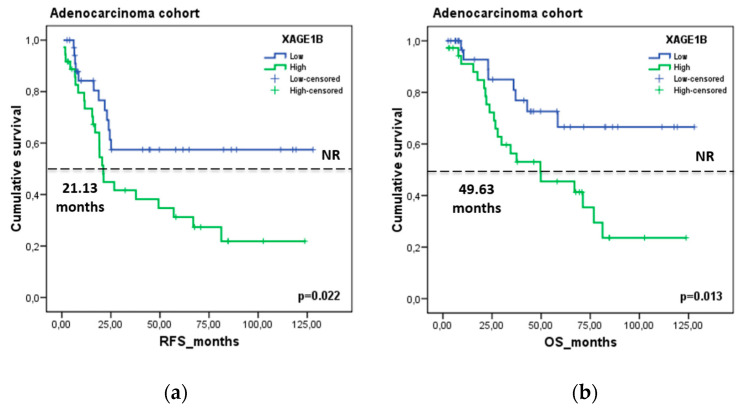
Figure 10.
Prognostic value of XAGE1B in the HGUV NSCLC cohort. Kaplan–Meier plot for (a) RFS and (b) OS according to gene expression relative to reference genes (ACTB, GUSB, CDKN2A) in the LUAD group. Blue lines represent patients with higher levels of XAGE1B expression, whereas green lines represent patients with lower expression levels. Cutoff values correspond to the median relative expression. p-values were calculated using the Kaplan–Meier test.

