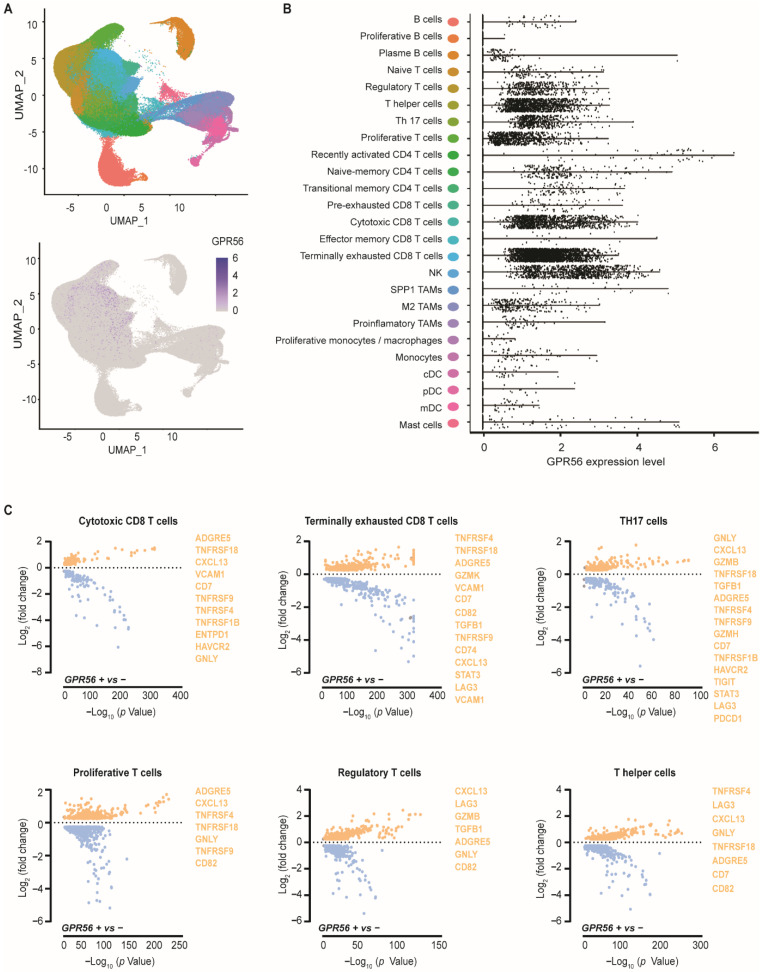
Figure 1.
GPR56 is expressed in cytotoxic and terminally exhausted CD8 TILs that display a tumor-reactive phenotype across multiple tumor types. (A) Single-cell tumor immune atlas RNA sequencing data-set based on over 500,000 cells from 217 patients and 13 cancer types revealing GPR56 expression within different immune cell subtypes. Visualized by a UMAP representation and in a grouped analysis. (B) displaying the different GPR56 expressing tumor infiltrating immune-cell subtypes. (C) Differential gene expression of the GPR56-positive vs. GPR56-negative populations within the cytotoxic CD8 T cells, terminally exhausted CD8 T cells, TH17 cells, proliferative T cells, regulatory T cells and T helper cells fractions, calculated using FindMarkers function from Seurat with MAST as the method of choice. Genes with a p-value ≤ 0.05 and log2FoldChange ≥ 0.25 are displayed, visualized in volcano plots using GraphPad Prism 8. Several upregulated effector, (pre-)exhausted and tumor reactive genes are highlighted in orange.

