Figure 2.
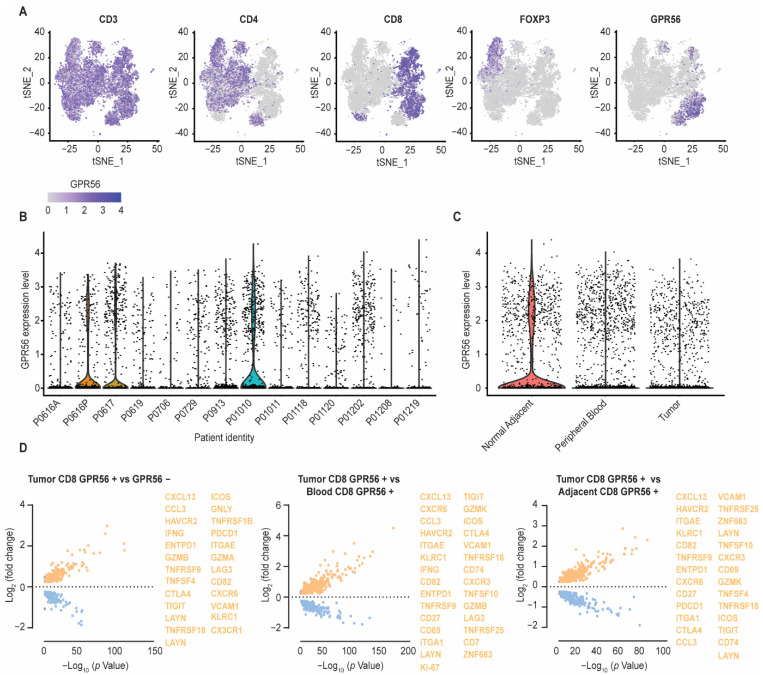
Compared to blood and adjacent tissue, tumor localized GPR56-positive CD8 T cells display a distinct gene expression profile with upregulated tumor-reactive markers. (A) GPR56 expression visualized within the CD3, CD4, CD8 and FOXP3-expresssing cell subsets by dimensional reduction analysis (t-SNE) using a single-cell RNA sequencing data set, consisting of 12,346 T cell samples isolated from the blood, healthy adjacent tissue and tumor tissue of 14 treatment-naïve non-small-cell lung cancer (NSCLC) patients. (B) Inter-patient GPR56 expression variability. (C) GPR56 expressing cells subdivided into their anatomical isolation sites (blood, healthy adjacent tissue and tumor tissue). (D) Differential gene expression of the GPR56-positive vs. GPR56-negative population within the CD8 T cell fraction isolated from tumor tissue (left) and differential gene expression of the GPR56-positive CD8 T cell fraction isolated from the tumor tissue vs. the GPR56-positive CD8 T cell fraction isolated from the blood (middle) and the healthy adjacent tissue (right). DEGs were calculated using FindMarkers function from Seurat with MAST as the method of choice. Genes with a p-value ≤ 0.05 and log2FoldChange ≥ 0.25 are displayed, visualized in volcano plots using GraphPad Prism 8. Several upregulated effector, (pre-)exhaused and tumor reactive genes are highlighted in orange.

