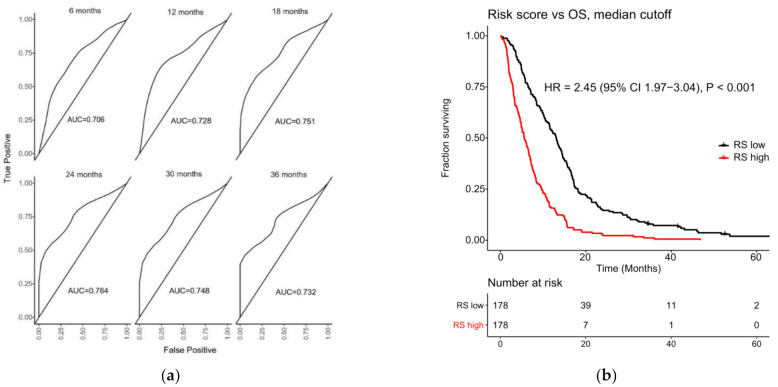
Figure 2.
Index II: (a) Time-dependent ROC curves for Index II (whole cohort). Plots shown for predicting OS at 6, 12, 18, 24, 30, and 36 months, respectively. AUC values shown for each plot. Y-axes show the true positives and x-axes show the false positives; (b) Kaplan–Meier plot showing the risk score developed using Index II for each patient, plotted against survival. The division of patients is < or > median risk score.

