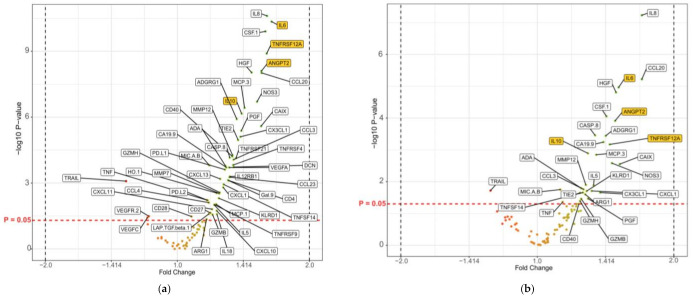
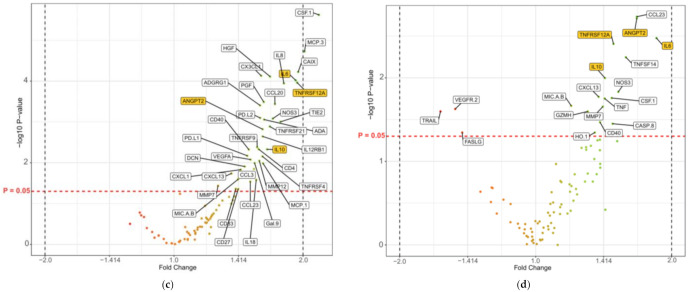
Figure 4.
Volcano plots of the comparison of circulating-protein levels in all patients divided by survival groups (≤180 days vs. >180 days) and treatment subgroups. The relationship between non-adjusted −log10 p values is described on the y-axis and fold changes on the x-axis for the proteins. Proteins with significant non-adjusted p values (p < 0.05) are labelled with abbreviated names. The horizontal red dashed line represents p = 0.05. The x-axes represent the fold change between protein levels in the survival groups (≤180 days vs. >180 days). An example is IL-10 in Figure 4a, which has a fold change of approximately 1.4, meaning that the IL-10 NPX-values in patients surviving ≤ 180 days is approximately 1.4 times higher than in patients surviving >180 days. The x-axes have been modified from a log2 scale. (a) All patients divided into survival groups of ≤180 days (n = 135) and >180 days (n = 228); (b) patients treated with gemcitabine (survival ≤180 days (n = 78) vs. >180 days (n = 105)); (c) patients treated with gemcitabine + nab-paclitaxel (survival ≤180 days (n = 34) vs. >180 days (n = 48)); and (d) patients treated with mFOLFIRINOX (survival ≤180 days (n = 23) vs. >180 days (n = 75).


