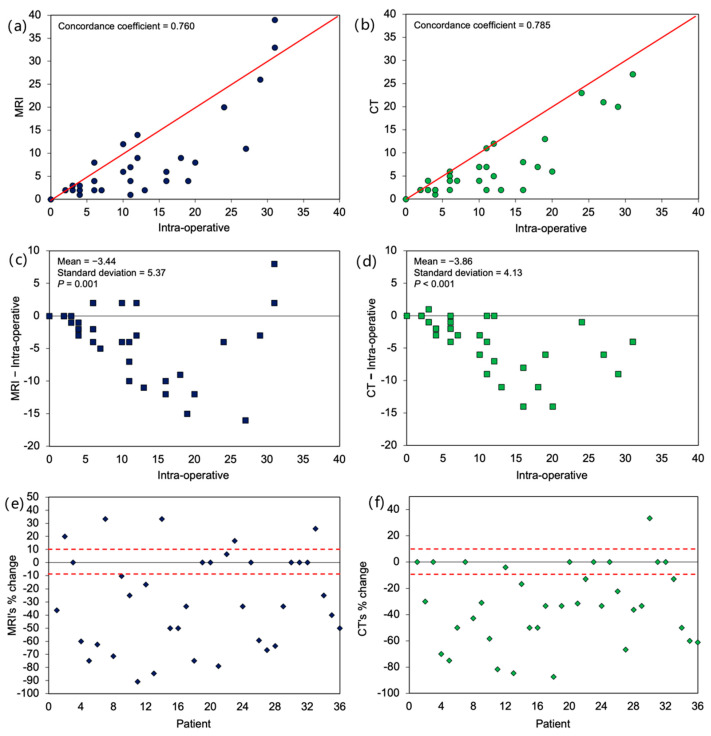
Figure 2.
Agreement between imaging and intra-operative total peritoneal cancer index score. Scatterplot of (a) MRI and (b) CT against intra-operative score. Scatterplot of difference from intra-operative score for (c) MRI and (d) CT. Percentage change of (e) MRI and (f) CT score from intra-operative score by individual patients with 10% accuracy bound. p-values in (b,c) were based on paired t-test, testing whether mean differences were different from zero.

