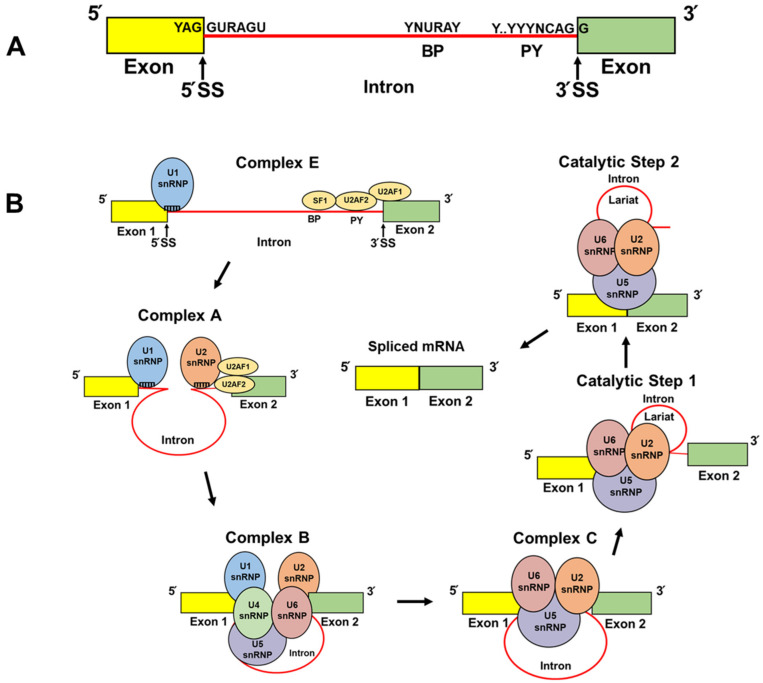
Figure 1.
Schematic representations of core splice site sequence elements and spliceosomal assembly and action. (A) Two exons (yellow and green) separated by an intron (shown in red). The positions and consensus sequences of the 5′ splice site (5′ SS), branch point (BP), polypyrimidine tract (PY), and 3′ splice site (3′ SS) are denoted. R symbolizes nucleotides A and G. Y symbolizes nucleotides C and U. N represents any purine or pyrimidine nucleotide. (B) Depicted are the simplified stepwise interactions of the U2AF heterodimer and SF1 to the BP, PY, and 3′ SS and the subsequent recruitment of the spliceosomal small nuclear ribonucleoprotein (snRNP) particles (U1, U2, U4, U5, and U6) [36,37,38]. The names of the complexes, and the first and second catalytic steps, are labeled.

