Figure 5.
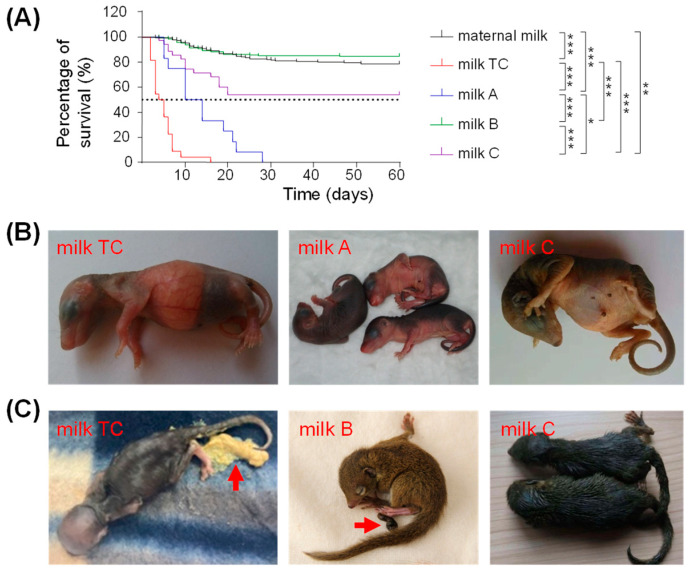
Survival curves and morphology of pups fed with maternal milk and artificial milk. (A) Kaplan–Meier survival curves of pups fed with different milks. Maternal milk, n = 224; milk TC, n = 22; milk A, n = 12; milk B, n = 214; and milk C, n = 35. * p < 0.05, ** p< 0.01, and *** p < 0.001. (B,C) Representative pictures of pups fed with different milk substitutes. (B) On postnatal day 4, pup fed with milk TC was skinny and has gastric food retention; pups fed with milk A had a completely empty stomach before feeding every morning; pups fed with milk C had mild diarrhea. (C) Pup fed with milk TC on postnatal day 13 had diarrhea with liquid, yellow stool (indicated by an arrow) and dehydration. Pup fed with milk B on postnatal day 22 had brown, soft, sausage-shaped feces (see arrow). Pups fed with milk C on postnatal day 18 had severe diarrhea.

