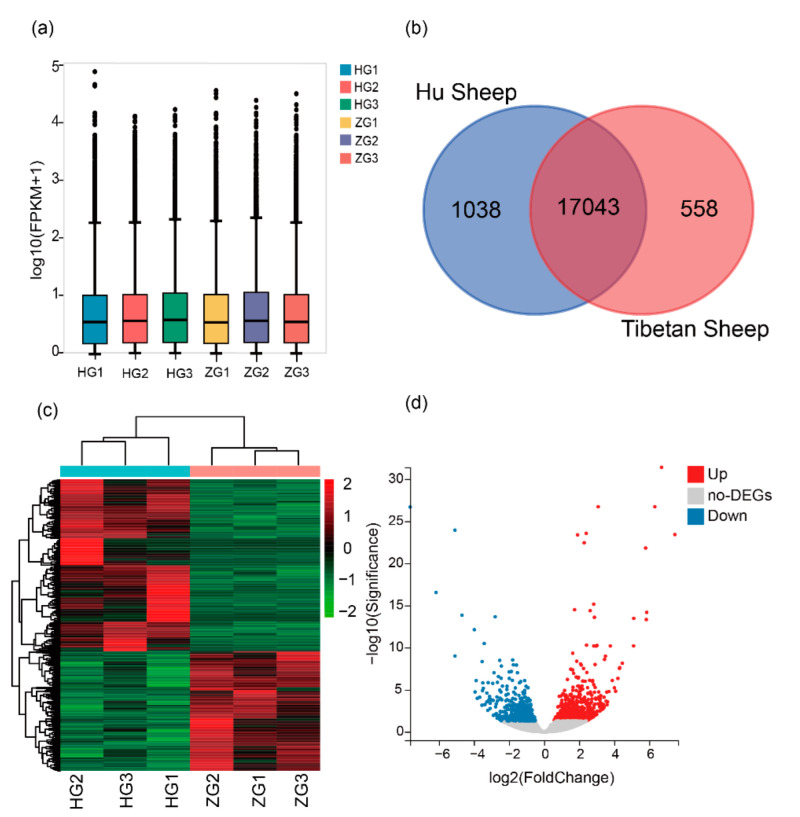
Figure 1.
(a) Box plot of FPKM distribution in six samples. The abscissa represents the sample name, and the ordinate represents log10(FPKM+1). HG1, HG2, and HG3 are representative of the Hu sheep liver. ZG1, ZG2, and ZG3 are representative of Tibetan sheep liver. (b) Venn diagram of genes expressed in the livers of Hu sheep and Tibetan sheep. (c) Heat map of the DEGs cluster analysis. The different columns represent different samples, with different rows representing different genes. (d) Volcano plot displaying DEGs (Q-value < 0.05) in the livers of Hu sheep and Tibetan sheep. Up, up-regulated DEGs; Down, down-regulated DEGs.

