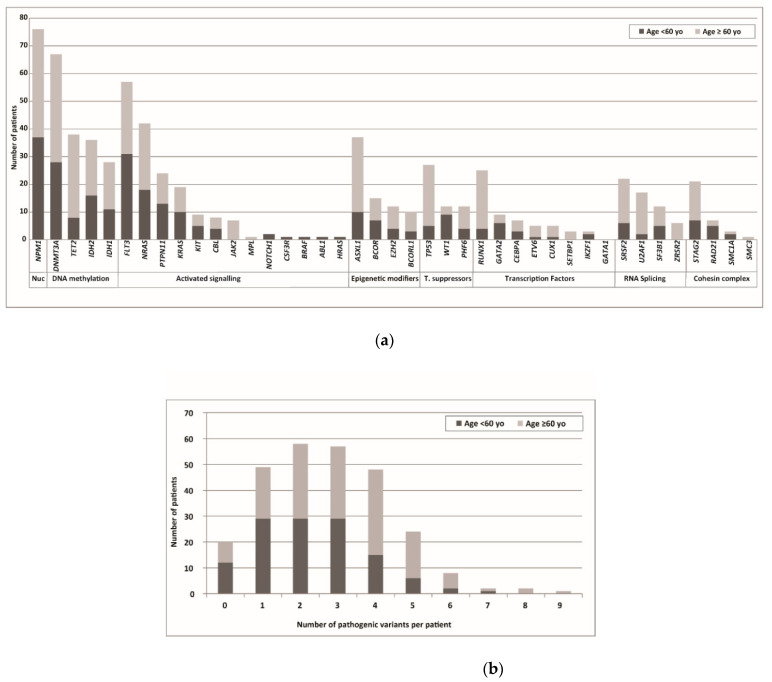
Figure 3.
Mutational landscape according to age. (a) Mutated genes were grouped into functional categories as in Figure 2. Each bar represents patients harboring a mutation in the indicated gene according to age, in younger (<60 years) and elderly (≥60 years) patients. (b) Number of pathogenic variants identified per sample in younger (<60 years) and elderly (≥60 years) patients.

