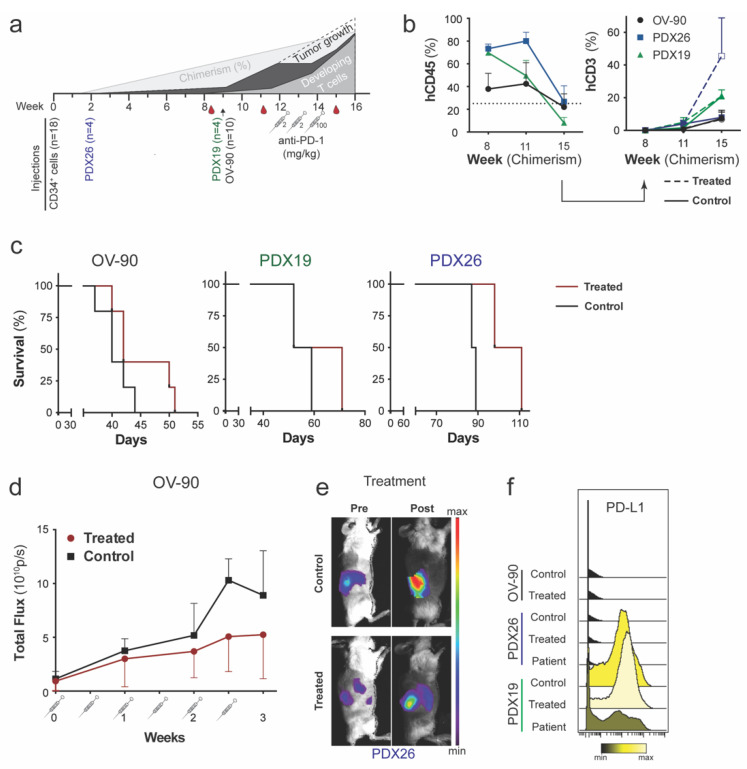
Figure 5.
Effect of Nivolumab on tumor growth and prolonged disease latency for an orthotopic OV-90luc+ cell line model and two patient-derived xenograft models. (a) Experimental design for anti-PD-1 nivolumab treatment with a schematic of expected tumor growth and developing T cells over time. Treatment started 12 weeks after intravenous injection of 1 × 10⁵ CD34+ cells in both CDX and PDX NSG models. Mice (n = 18) were allocated to treatment and control arms at week 11 according to bioluminescence signal intensity, chimerism level (blood sample week 11) and frequency of T cells (blood sample week 11). The treatment group received 2 mg/kg nivolumab intraperitoneally twice a week for two consecutive weeks and 100 mg/kg twice in the third week of treatment. Blood samples were collected in week 8 to confirm the successful immune reconstitution, in week 11 to allocate the mice into control and treatment groups, and week 15 to assess the effect of treatment. The 11-week samples additionally served as reference pretreatment samples for mass cytometry analysis. (b) Frequency of human leukocytes and T cells in mouse blood measured by flow cytometry in weeks 8, 11 and 15 after treatment (weeks from CD34+ cell injection). Human leukocytes are shown for all mice (n = 18) and CD3 positive cells are presented separately for treated (dashed lines, n = 9) and untreated (solid lines, n = 9) mice. (c) Survival of OV-90luc+ (n = 10), PDX19 (n = 4), and PDX26 (n = 4) mice measured as days after the start of tumor engraftment. (d) Bioluminescence imaging of OV-90luc+ mice was performed to monitor tumor growth during treatment (n = 5/group). (e) One representative fluorescence image of patient-derived xenografts (PDX26) in control and treated mice pre- and post-treatment. (f) Histograms of PD-L1 expression on tumor cells (black = minimum, yellow = maximum median dual count) by mass cytometry.

