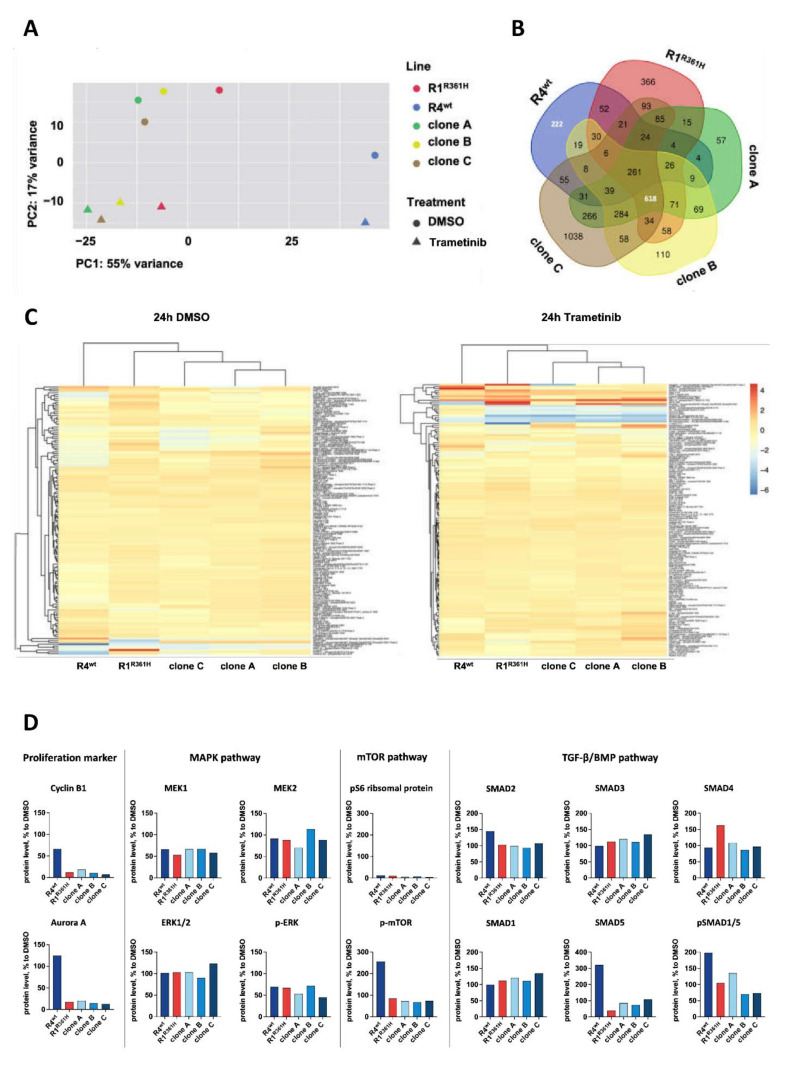
Figure 3.
BMP-pathway is activated in SMAD4wt cells in response to MEK-inhibition. (A) Principal Component Analysis of mRNA expression of R4wt, R1R361H, and CRISPR-SMAD4R361H PDOs (clones A, B, and C). The first component on the x-axis contains 55% of the variance and classifies the samples into two major groups R1R361H/CRISPR-SMAD4R361H PDOs (treated with trametinib and untreated) and R4wt (treated with trametinib and untreated). (B) Five-set Venn diagram showing unique and overlapping genes from RNA sequencing of R4wt, R1R361H, and CRISPR-SMAD4R361H PDOs (clones A, B, and C). (C) Heatmap of differentially expressed total and (phospho-) proteins in R4wt, R1R361H, and CRISPR-SMAD4R361H PDOs (clones A, B, and C) after 24 h-treatment with DMSO (0.3%) and trametinib (0.03 µM) (all normalized over beta-actin, log2 fold change trametinib/DMSO. (D) Protein levels [%] involved in proliferation, MAPK pathway, mTOR pathway, and TGF-β/BMP pathway after 24 h-treatment with DMSO (0.3%) and trametinib (0.03 µM). Protein levels were normalized over beta-actin (treatment to DMSO control) in [%] or rather the ratio of phospho-protein level to the total protein level of replicates. (See also Table S4).

