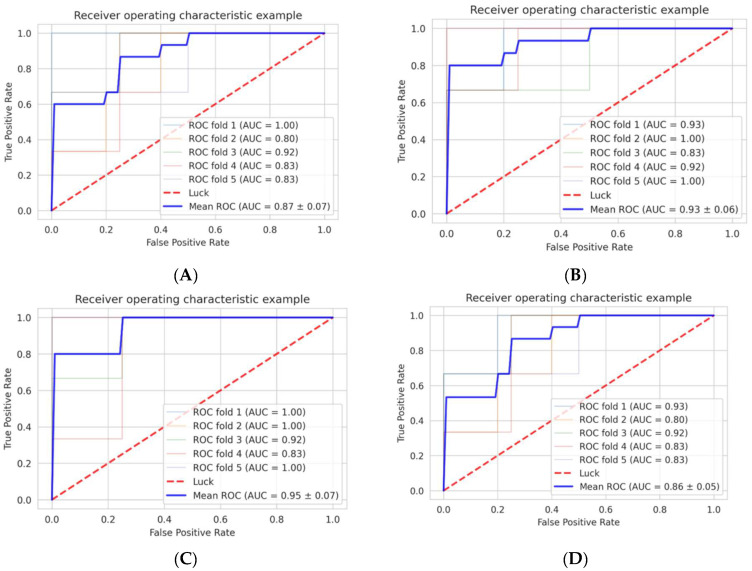
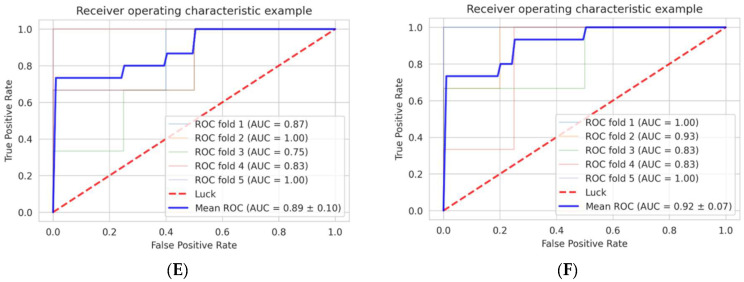
Figure 3.
Diagnostic accuracy of the machine learning models in the training dataset (refer to Figure 2). (A) The AUC of the model with T2 logistic regression. (B) The AUC of the model with GdT1 logistic regression. (C) The AUC of the model with T2 and GdT1 logistic regression. (D) The AUC of the model with T2 SVM. (E) The AUC of the model with GdT1 SVM. (F) The AUC of the model with T2 and GdT1 SVM. The number of each mean ROC represents mean +/− standard deviation of the 6 AUCs. Abbreviations: receiver operating characteristics—ROC; area under the curve—AUC; T2 weighted image—T2; post-gadolinium T1-weighted images—GdT1; support vector machine—SVM.


