FIGURE 3:
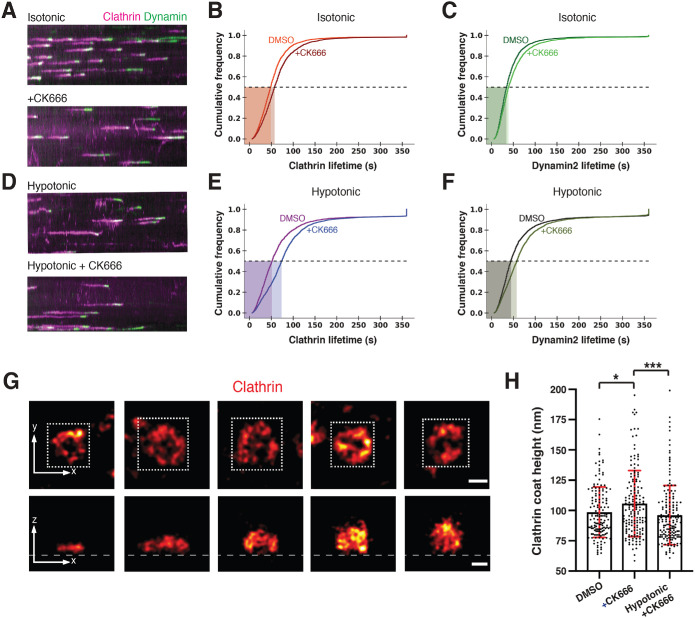
Importance of Arp2/3 complex–mediated actin polymerization during CME increases under elevated membrane tension. In this figure, CK666 (Arp2/3 complex inhibitor) treatment is 100 µM and hypotonic shock is 150 mOsm. (A) Kymographs of cells expressing CLTA-TagRFP-TEN (magenta) and DNM2-eGFPEN (green) imaged by TIRF. Cells were imaged in isotonic media. The media was then exchanged to include CK666 (bottom panel) and imaged after 4 min. (B) Cumulative distribution plots of clathrin lifetimes in control, DMSO-treated conditions (orange, n = 4219), and CK666-treated (red, n = 3124) conditions. (C) Cumulative distribution plots for control, DMSO-treated (dark green, n = 4219), and CK666-treated (light green, n = 3124) dynamin2 lifetimes associated with clathrin lifetimes in B. (BC) Control, N = 10 cells, and CK666 treatment, N = 10 cells, measured in three independent experiments. Complete statistics in Supplemental Table S3. (D) Kymographs of cells in hypotonic media. In the top panel, cells were placed in hypotonic media and imaged after 4 min. In the bottom panel, cells were treated with CK666 in hypotonic media and imaged after 4 min. (E) Cumulative distribution plots of clathrin lifetimes for control, DMSO-treated conditions (magenta, n = 1405), and CK666-treated conditions (blue, n = 2783) in hypotonic media. (F) Cumulative distribution plots of DMSO-treated (black, n = 1405) and CK666-treated (olive, n = 2783) dynamin2 lifetimes in hypotonic media associated with clathrin lifetimes in E. (E, F) Control, N = 9 cells, and CK666 treatment, N = 10 cells, measured in three independent experiments. Complete statistics in Supplemental Table S3. (G) Representative STORM images of immunolabeled clathrin-coated structures in control cells arranged by coat height. Top panel shows the x-y projections and bottom panel the corresponding x-z projections. The white square in the x-y projections shows the area that was cropped to generate the x-z projections. The heights of clathrin coats in the x-y projection from left to right image are 61, 96, 124, 158, and 177 nm. Scale bars: 100 nm. (H) Clathrin coat heights when cells were treated with DMSO (n = 154) or CK666 (n = 158) in isotonic media or CK666 in hypotonic media (n = 159). Clathrin coat images for quantitative analysis were collected from at least three different cells for each condition from a single experiment. Statistics are given in Supplemental Figure S8F. p < 0.05 in both comparisons by Mann–Whitney test.

