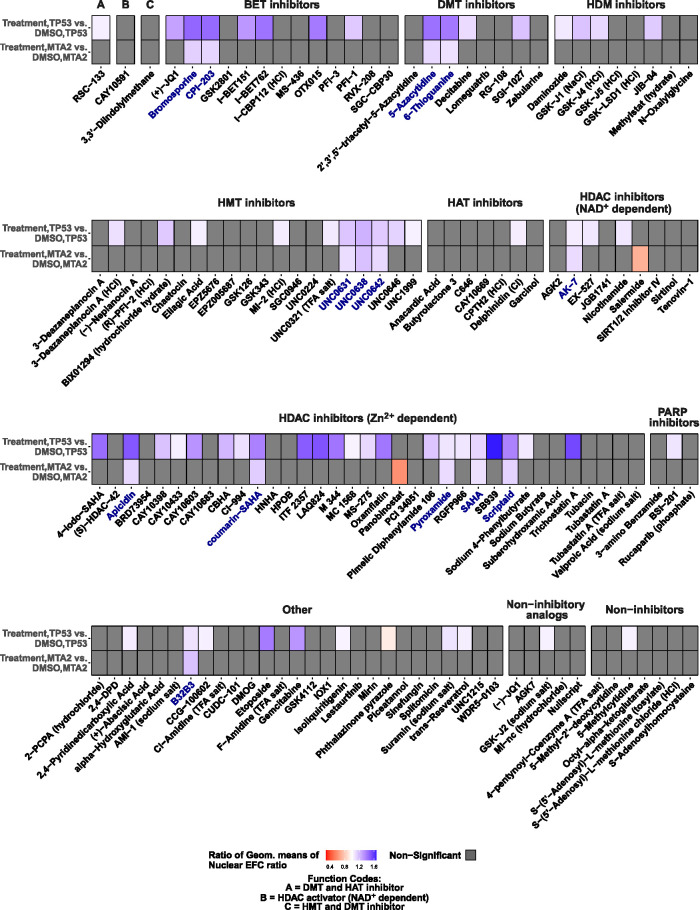
FIGURE 2:
Analysis of the extent to which small molecule compound libraries alter nuclear morphological abnormalities in MCF10A cells transfected with siRNA toward TP53 or MTA2. Heat maps show within-group comparisons of small molecule compound library effects on nuclear EFC ratios in TP53- or MTA2–knockdown cells. Comparisons are shown of treatment vs. DMSO effects within gene-knockdown datasets. The treatments are grouped by the small molecule functions; cells were imaged for each treatment condition from four different wells (four technical replicates). For each small molecule treatment (1 µM dose), the ratio of geometric means of nuclear EFC ratios for that treatment group to the DMSO group for a given knockdown condition (TP53 or MTA2) is displayed as a heat map. Ratios of geometric means statistically significantly greater than 1 are displayed in shades of blue (improvement of nuclear shapes), those statistically significantly less than 1 are displayed in shades of orange (worsening of nuclear shapes), and those not statistically significantly different from 1 are displayed as gray. Compound names highlighted in blue indicate that the ratio of geometric means was statistically significantly different from 1 in both gene-knockdown conditions. BET, bromodomain and extraterminal domain; DMT, DNA methyltransferase; HDM, histone demethylase; HMT, histone methyltransferase; HAT, histone acetyltransferase; HDAC, histone deacetylase; PARP, poly adenosine diphosphate-ribose polymerase. Statistical comparisons were performed with tests of contrasts on an omnibus two-way ANOVA model (see Materials and Methods). The number of nuclei per treatment, adjusted p values, and estimates of contrasts are provided in Supplemental Table S2.

