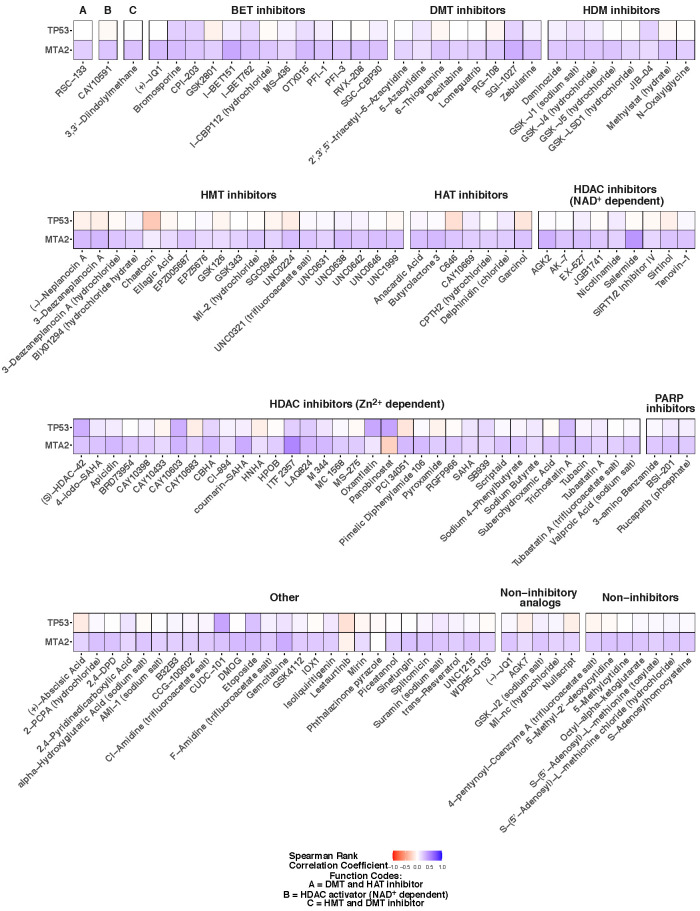
FIGURE 4:
Correlation analysis of nuclear projected area and nuclear EFC ratio. Heat maps show Spearman correlation coefficients between nuclear projected area and EFC ratios for each treatment in TP53- or MTA2-knockdown cells. The treatments are grouped by small molecule functions; cells were imaged for each treatment condition from four different wells (four technical replicates). Correlation coefficients less than 0 are displayed in shades of orange, and those above 0 are displayed in shades of blue.

