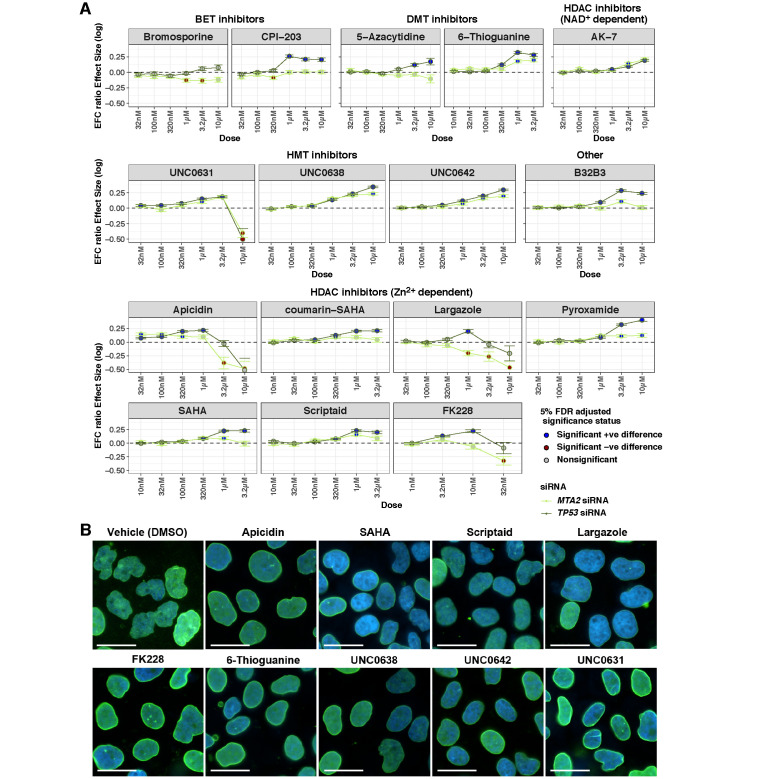
FIGURE 5:
Dependence of nuclear shape and the EFC ratio on the compound dose in a targeted screen of drugs in TP53- and MTA2-knockdown MCF10A cells. (A) For each compound, the corresponding panel plots the log of the ratio of geometric means of nuclear EFC ratios (y axis) at different doses (x axis) for that drug group to the DMSO group for a given knockdown condition (TP53 in the gray line or MTA2 in the green line). Cells were imaged for each treatment condition from four different wells (four technical replicates). Ratios of geometric means statistically significantly greater than 1 are displayed with blue dots; those statistically significantly less than 1 are displayed with brown dots; those not statistically significantly different from 1 are displayed with gray dots. (B) Representative nuclear shapes in TP53-knockdown MCF10A cells for select hits that showed improvement at doses lower than the dose tested in the screen (1 µM) compared with the vehicle control (DMSO). Overlaid image of nuclei stained with DAPI (blue) and immunostained for lamin A/C (green) are shown. Scale bars represent 25 µm. Statistical comparisons were performed with tests of contrasts on an omnibus three-way ANOVA model (see Materials and Methods). The number of nuclei per treatment, adjusted p values, and estimates of contrasts are provided in Supplemental Table S4.

