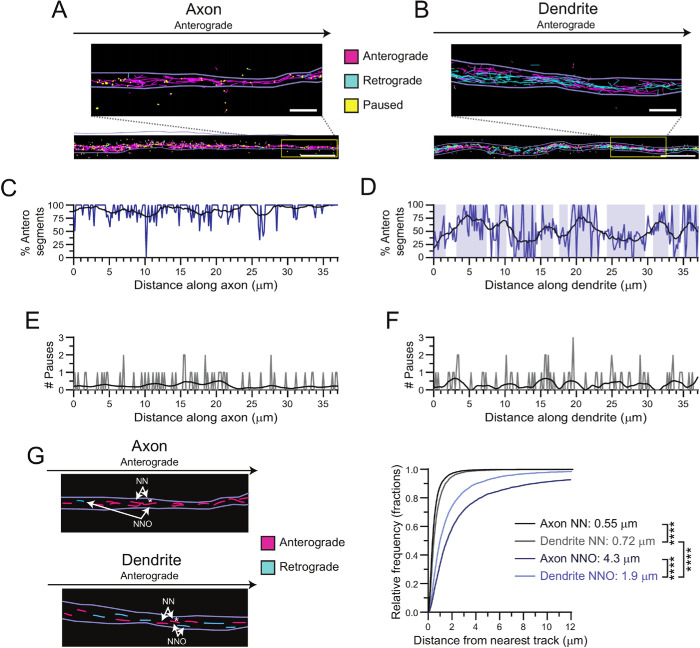
FIGURE 3:
Dendritic MTs are distributed heterogeneously. (A, B) Single particle motor track segments from a single TIRF movie. Light purple lines indicate bounds of axonal or dendritic process. Segments moving to the right (anterograde) are plotted in magenta, those moving to the left (retrograde) are cyan, and paused spots are shown in yellow. Zoom-in images show the separation between tracks. Scale bar: 5 µm. Zoom-in scale bar: 1 µm. (C, D) Percentage of anterograde track segments across the long axis of the axon and dendrite shown in A and B. Shaded blue areas indicate regions where the percentage of anterograde segments is above or below 50% in the dendritic process. Black lines show smoothed trendline over 2 µm window. (E, F) Number of paused track segments located across the long axis of the axon and dendrite shown in A and B. Black lines show smoothed trendline over 2 µm window. (G) Schematic of nearest neighbor (NN) track and nearest neighbor opposing (NNO) track and cumulative distribution of the distance between each anterograde moving track segment and its NN moving in any direction or NNO moving in the opposite direction in both axons and dendrites. A single exponential decay function was fitted to the data. Listed are the average distances traveled, as calculated by taking the inverse of the rate constant. Kruskal–Wallis one-way ANOVA and Dunn’s multiple comparison (****p < 0.0001). Unless otherwise indicated, data from 59–80 processes from n = 49–50 neurons and N = 4 independent experiments.

