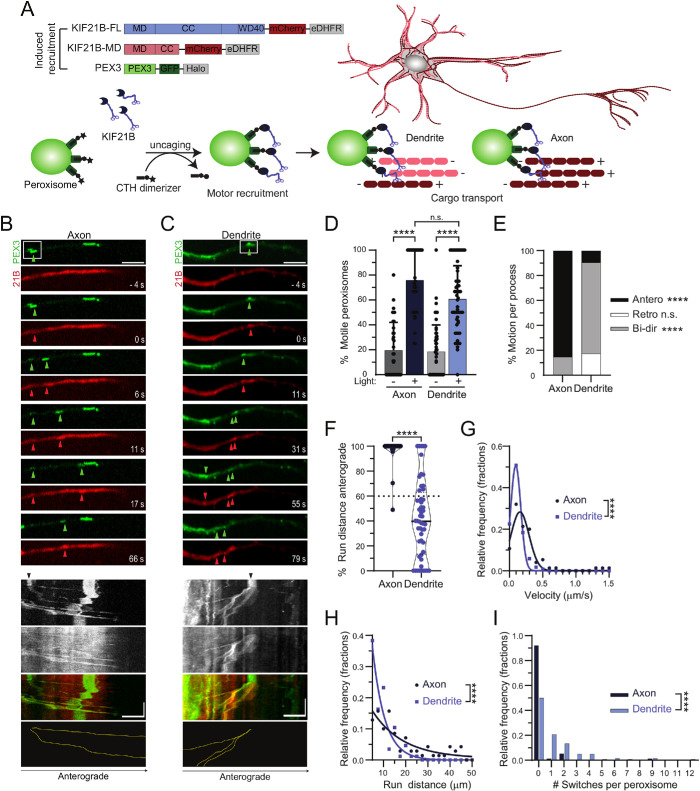
FIGURE 5:
Induced recruitment of KIF21B motors to peroxisome cargo in live neurons promotes retrograde trafficking in dendrites. (A) Diagram of motor constructs and experimental schematic for induced recruitment experiments in live neurons. Dark red and pink lines and plus and minus signs indicate MT orientation within arrays; antiparallel MT arrays in dendrites and parallel arrays in axons. (B, C) Time series and corresponding kymograph showing movement of photoactivated (white box) peroxisomes in axons and dendrites. Green and red arrowheads indicate the locations of photoactivated peroxisomes with successful KIF21B recruitment in both the PEX3 and KIF21B fluorescence channel, respectively. Black arrows on kymographs indicate regions of photoactivation. Yellow traces indicate movement of the KIF21B–recruited peroxisomes identified in the time series. Scale bars: 5 µm (horizontal) and 1 min (vertical). (D) Percentage of peroxisomes that are motile in axons and dendrites with and without photoactivation. Plotted are means and SDs. Kruskal–Wallis one-way ANOVA and Dunn’s multiple comparison (n.s. p > 0.05; ****p < 0.0001). (E) Percentage of peroxisome runs moving anterograde, retrograde, or bidirectionally for each axonal and dendritic process. Bidirectional (Bi-dir) movement is characterized by peroxisomes that move more than 0.4 µm in both anterograde (Antero) and retrograde (Retro) directions. Two-way ANOVA and Tukey multiple comparison (n.s. p > 0.05; ****p < 0.0001). (F) Percentage of total peroxisome run distance per process moving in the anterograde direction. Plotted are individual values in color, means in solid black line. and 25th and 75th quartiles in dashed black lines. Two-tailed Mann–Whitney test (****p < 0.0001). (G) Histogram of velocities of motile peroxisomes after photoactivation in axons and dendrites. Data points were fitted by a Gaussian function. Two-tailed Mann–Whitney test (****p < 0.0001). (H) Histogram of run distances of motile peroxisomes after photoactivation. Data points were fitted by a single exponential decay function. Two-tailed Mann–Whitney test (****p < 0.0001). (I) Histogram of number of track switches per peroxisome run in axons and dendrites. Track switches are characterized by a reversal in direction that exceeds 0.4 µm in both anterograde and retrograde directions. Two-tailed Mann–Whitney test (****p < 0.0001). Data from 76–120 peroxisomes from n = 34–52 neurons and N = 6 independent experiments.

