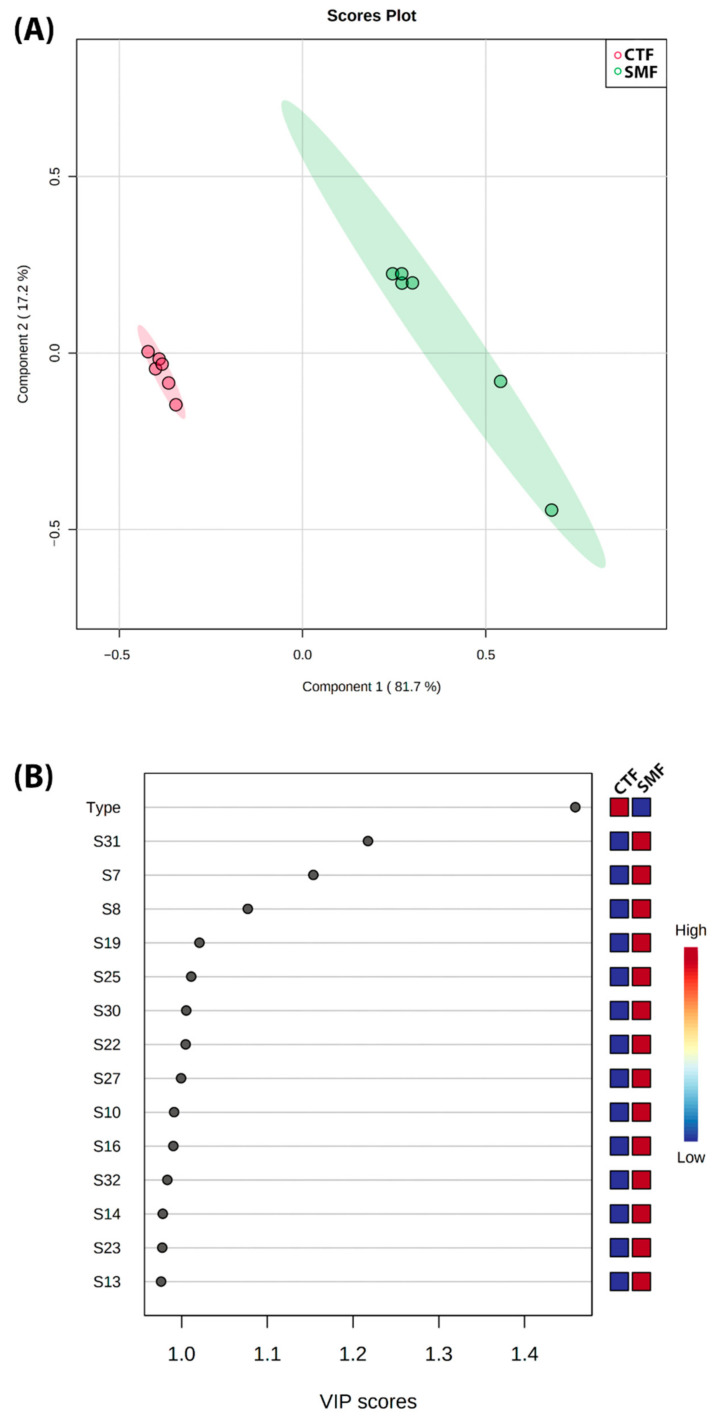
Figure 6.
(A) Partial least squares discriminant analysis (PLS-DA) score plot in 2D graphs using the concentrations of all VOCs grouped by dairy breed. (B) Variable Importance in Projection (VIP) plots derived from the e-nose signals for the VOCs by two types of F-MC manufactured with milk from different dairy breeds (Holstein vs. Jersey).

