Figure 1.
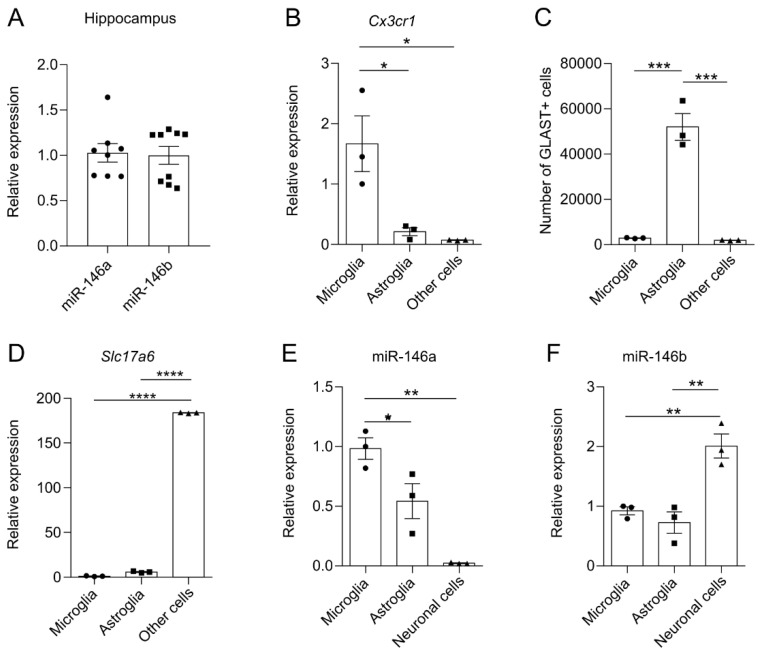
Expression of miR-146a and miR-146b in hippocampus and cellular fractions isolated from WT mice. (A) Quantification of miR-146a/b expression in the hippocampus of WT mice. Number of animals in (A) = 8–9, Student’s t-test. (B–D) Characteristics of the cellular fractions isolated from the WT mouse brain. (B) Relative mRNA expression of microglial Cx3cr1. (C) Number of astroglial marker GLAST+ cells (determined by flow cytometry). (D) Relative expression of neuronal marker Slc17a6 mRNA levels. As fraction of “other cells” abundantly expressed neuronal marker Slc17a6 mRNA, this fraction was named as neuronal cells. (E) Quantification of miR-146a and (F) miR-146b in microglia, astroglia and neuronal cells of WT mice. Number of cell batches in experiments (B–F) = 3, one-way ANOVA followed by Tukey’s multiple comparison test. Data represented as mean ± SEM; * p < 0.05, ** p < 0.01, *** p < 0.001, **** p < 0.0001.

