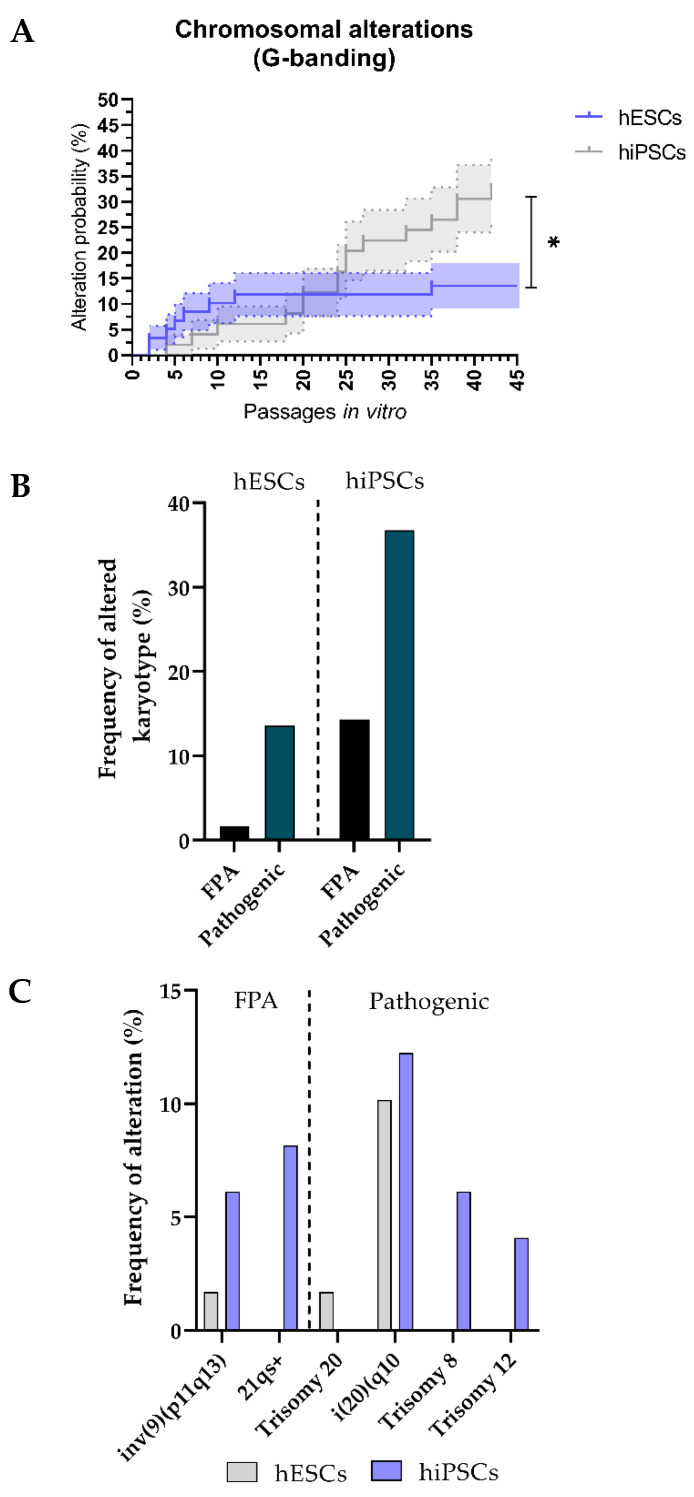
Figure 4.
The hiPSCs lines show a higher prevalence of karyotype genomic aberrations detected by G-banding as compared to hESCs: (A) Survival analysis (Kaplan–Meier curves) of the evolution of the probability (%) of hESCs and hiPSCs being affected by chromosomal genomic alterations detected by G-banding over time (passages in vitro). Error bars represent standard error of the mean (s.e.m.); (B) bar graph of percentage of frequency of all alterations found in hESCs compared with hiPSCs on a total number of 108 karyotypes performed; (C) histogram showing the frequency at which different types of FPAs and pathologic alterations are detected in hESCs and hiPSCs via karyotype. FPA: Frequent Polymorphic Alterations.

