Figure 1.
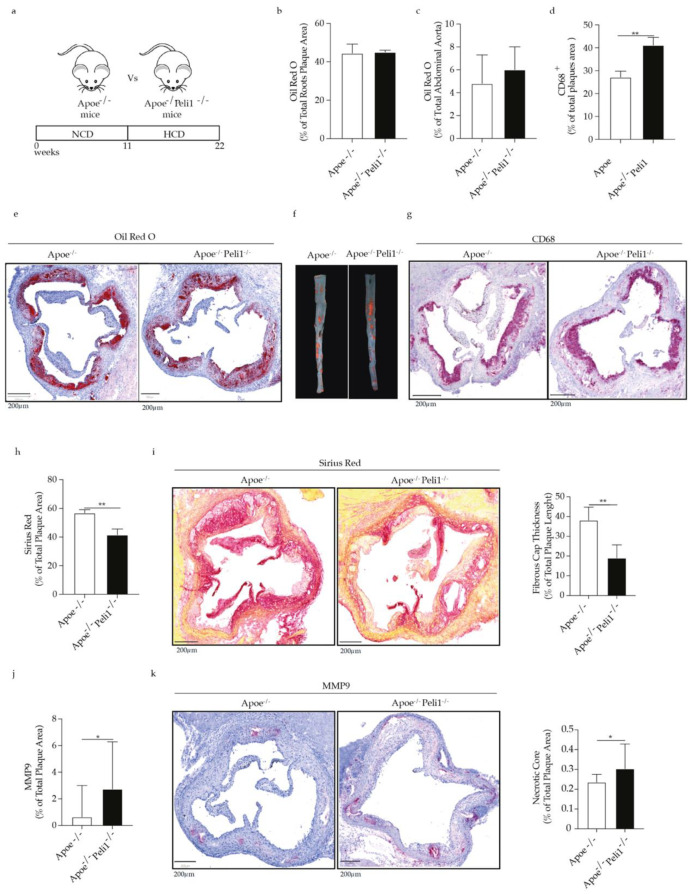
(a) Scheme illustrating the animal experimental settings. Bar graphs represent lipids accumulation as quantified by Oil Red O staining (b) in the aortic roots (c) in the abdominal aorta of Apoe−/− and Apoe−/− Peli1−/− mice. (d) Bar graphs represent quantification of total CD68 macrophages present in the aortic roots of Apoe−/− and Apoe−/− Peli1−/− mice on HCD. Representative images of (e) Oil Red O staining in the aortic roots, (f) Oil Red O staining in the abdominal aorta and (g) CD68 immunohistochemistry staining in the aortic roots of Apoe−/− and Apoe−/− Peli1−/− mice. (h) Bar graphs and representative images showing quantification of collagen accumulation in the aortic roots of Apoe−/− and Apoe−/− Peli1−/− mice fed HCD. (i) Bar graphs represent the quantification of the fibrous cap thickness in Apoe−/− and Apoe−/− Peli1/− mice fed HCD. (j) Bar graphs and representative images showing the quantification of MMP9 expression in the aortic roots of Apoe−/− and Apoe−/− Peli1−/− mice fed HCD. (k) Bar graphs represent the quantification of necrotic core area in the aortic roots of Apoe−/− and Apoe−/− Peli1−/− mice, fed HCD, n = 7–8/group, U-Mann Whiney, all data are presented as median with interquartile range with p ≤ 0.05 * and p ≤ 0.01 **.

