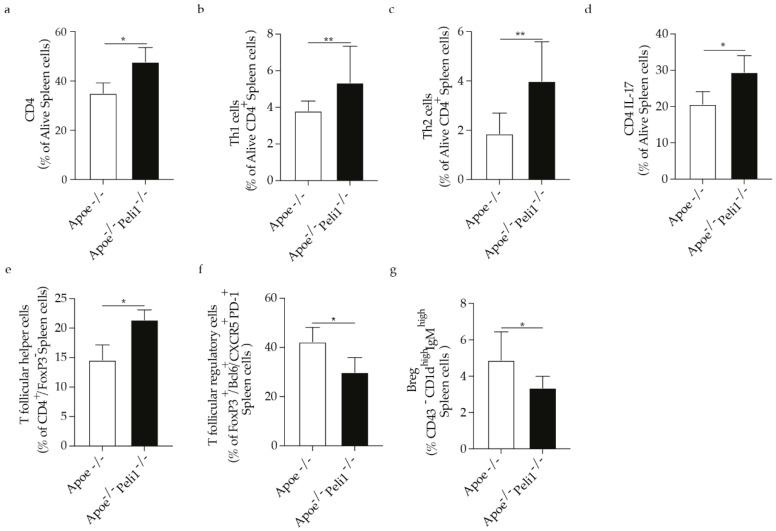
Figure 3.
Bar graphs represent the quantification of the spleen (SP) (a) total CD4 cells; (b) Th1 cells; (c) Th2 cells; (d) CD4 IL-17 cells; (e) Follicular helper T cells; (f) Follicular regulatory T cells and (g) Breg cells in of Apoe−/− and Apoe−/− Peli1−/− mice on HCD, n = 7–8/group, U-Mann Whiney, all data are presented as median with interquartile range with ± s.e.m with p ≤ 0.05 * and p ≤ 0.01 **.

