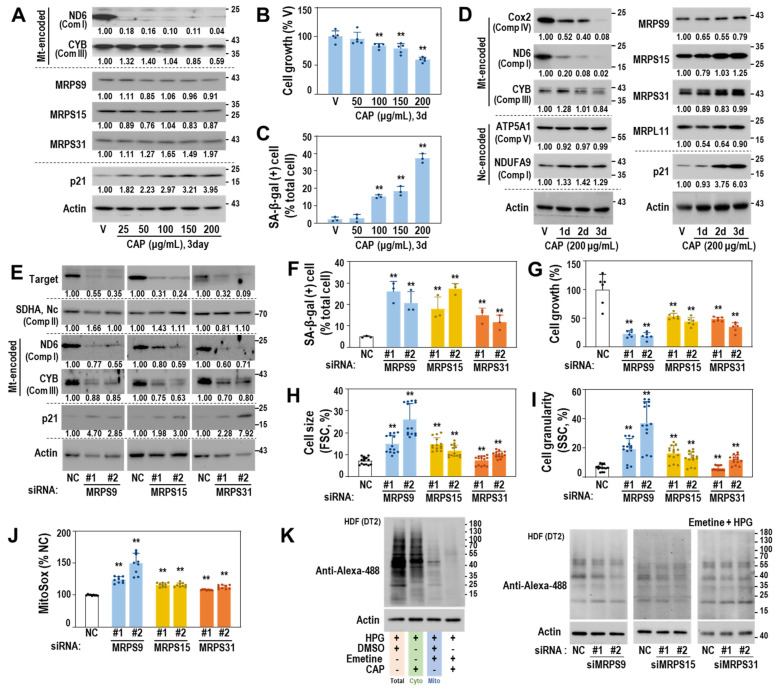
Figure 4.
Mitoribosome perturbation induces mitochondrial ROS generation and senescence. (A–D) HDF (DT2) was treated with the indicated doses of chloramphenicol (CAP), a specific mitoribosome inhibitor. DMSO was used as a vehicle (V) for CAP. (A) Western blots. Representative blot images and their quantified values are shown. (B) Cell growth. (C) SA-β-gal activity. **, p < 0.01 vs. V (0.4%) by Student’s t-test in (B,C). (D) Western blots. Representative blot images and their quantified values are shown. (E–K) HDF (DT2) was individually transfected with siRNAs for the indicated MRPs for 4 days. For the negative control (NC), a siRNA with a random sequence was used. (E) Western blots. Representative blot images and their quantified values are shown. (F) SA-β-gal activity. (G) Cell growth. (H) Cell size (FSC). (I) Cell granularity (SSC). (J) Mitochondrial ROS (MitoSOX staining). **, p < 0.01 vs. NC by Student’s t-test in (F–J). (K) Mitochondrial translation activity. To selectively monitor mitochondrial translation activity, emetine (a cytosolic translation inhibitor) and homopropargylglycine (HPG—a tracer of nascent protein synthesis) were used as described in Materials and Methods. A representative image of protein translation activities for total, cytosol (Cyto), and mitochondria (Mito) is shown in the left panel and selective mitochondrial translation activities after the individual knockdown of the three MRPs are shown in the right panel.

