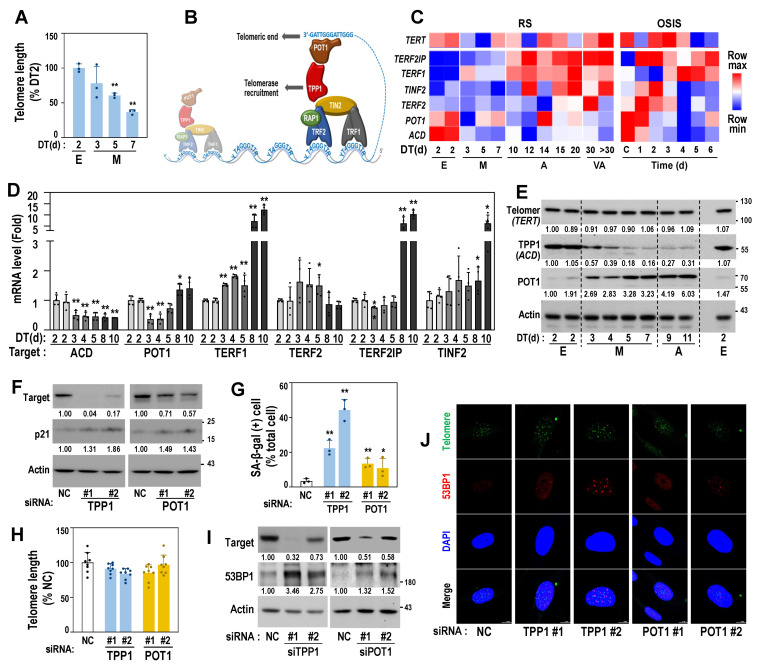
Figure 5.
TPP1 expression decreases from the M stage of RS and its suppression induces senescence, accompanied by telomere DNA damage. (A) Relative telomere length of HDFs at early (E) and middle (M) stages of HDF-RS was estimated, as described in Materials and Methods. **, p < 0.01 vs. DT2 by Student’s t-test. (B) Schematic structure of shelterin complex. (C) Expression heatmap of TERT (telomerase) and shelterin complex genes in RS and OSIS was obtained from our previous time-series transcriptomic data (GSE41714 and GSE80322). (D) Messenger RNA levels of HDFs at the indicated DT of RS model by qPCR analysis. HDFs with two different cell population doubling (PD32 and PD35) were used for DT2. **, p < 0.01 and *, p < 0.05 vs. DT2 (PD32) by Student’s t-test. (E) Western blots of time-series HDF-RS. Representative blot images and their quantified values are shown. (F–J) HDF (DT2) was individually transfected with siRNAs for the target genes for 4 days. (F) Western blot. Representative blot images and their quantified values are shown. (G) SA-β-gal activity. **, p < 0.01 and *, p < 0.05 vs. NC by Student’s t-test. (H) Telomere length analysis. (I) Western blot. Representative blot images and their quantified values are shown. (J) Telomere dysfunction-induced focus (TIF), a co-localized focus of telomere (green), and 53BP1 (red) were visualized by IF–FISH, as described in Materials and Methods. DAPI (blue) staining was used to visualize nuclei. Quantifications of the TIFs are presented in Supplementary Figure S4A.

